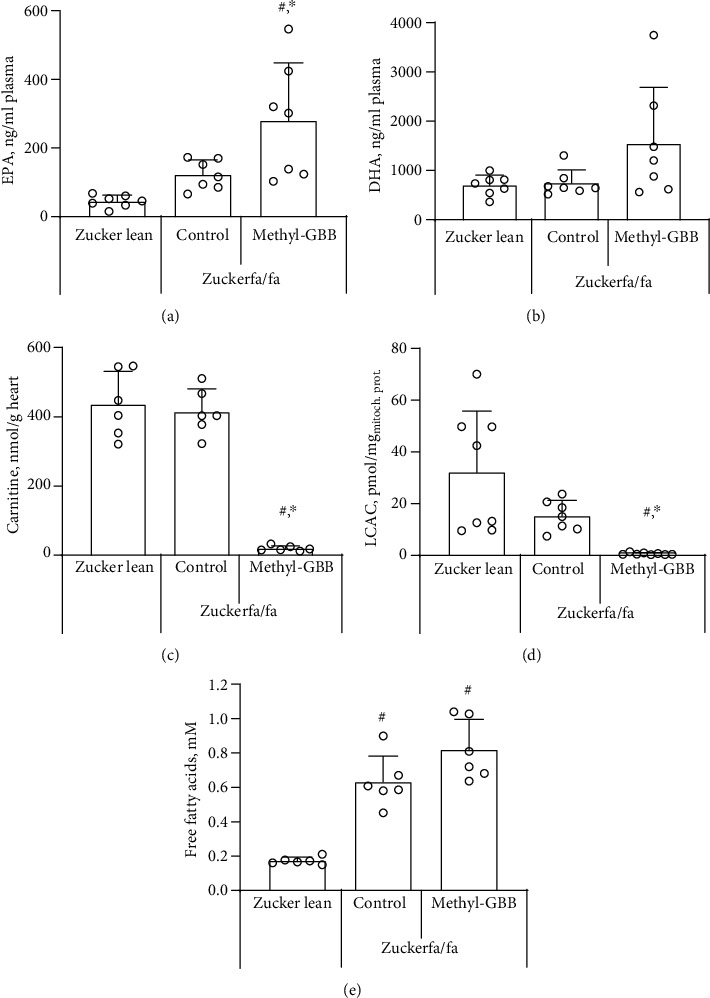
Figure 1.

The effect of methyl-GBB administration on plasma EPA (a) and DHA (b) concentrations, cardiac tissue carnitine content (c), mitochondrial LCAC content (d), and plasma free fatty acid concentration (e) after 12 weeks of treatment. Each value was calculated as the mean ± S.E.M. of 7 rats for (a) and (b), 6 rats for (c) and (e), and 8(7) rats for (d). ∗Significantly different from the Zucker fa/fa control group; #significantly different from the Zucker lean rat group (ANOVA followed by Tukey's test; P < 0.05).
