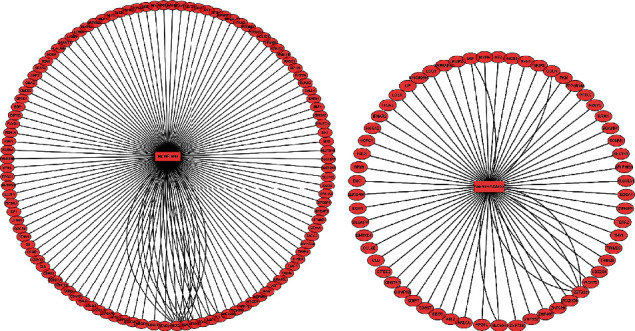
Figure 7.

Regulatory circuits of (a) hsa-miR-1228-5p-mRNA and (b) hsa-miR-4488-mRNA. Blue circles represent miRs, and pink circles represent mRNAs. The lines represent an interaction between the nodes. The number of lines that connect genes reveals the number of case studies that have reported an association between the target genes and miRNAs according to multiMiR database. hsa: Homo sapiens; miR: microRNA.
