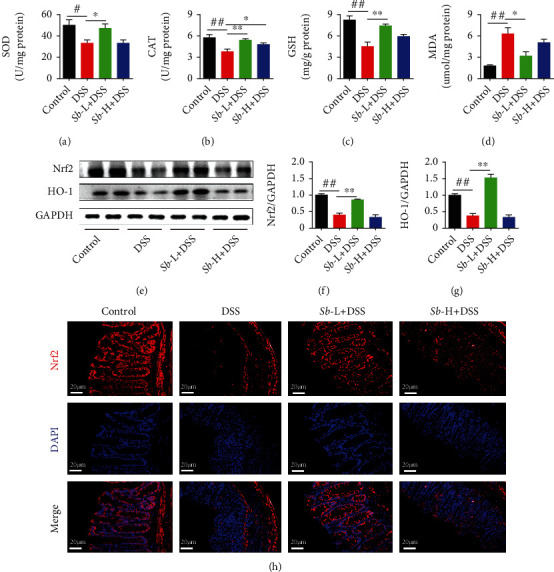
Figure 6.

Detraction effect of S. boulardii on Nrf2 signaling pathway in DSS-induced colitis mice. Colon oxidative stress-related indicators (a) SOD, (b) CAT, (c) GSH, and (d) MDA. Representative western blot images (e) and quantification of (f) Nrf2 and (g) HO-1. (h) Immunofluorescence staining of Nrf2 (red) in colon (magnification: ×400; scale bar: 20 μm). DAPI was used for nuclear counterstaining (blue). N = 6. Values are presented as mean ± SEM. #P < 0.05 and ##P < 0.01 compared with control group; ∗P < 0.05 and ∗∗P < 0.01 compared with the DSS groups. Sb: S. boulardii.
