
Figure 6.
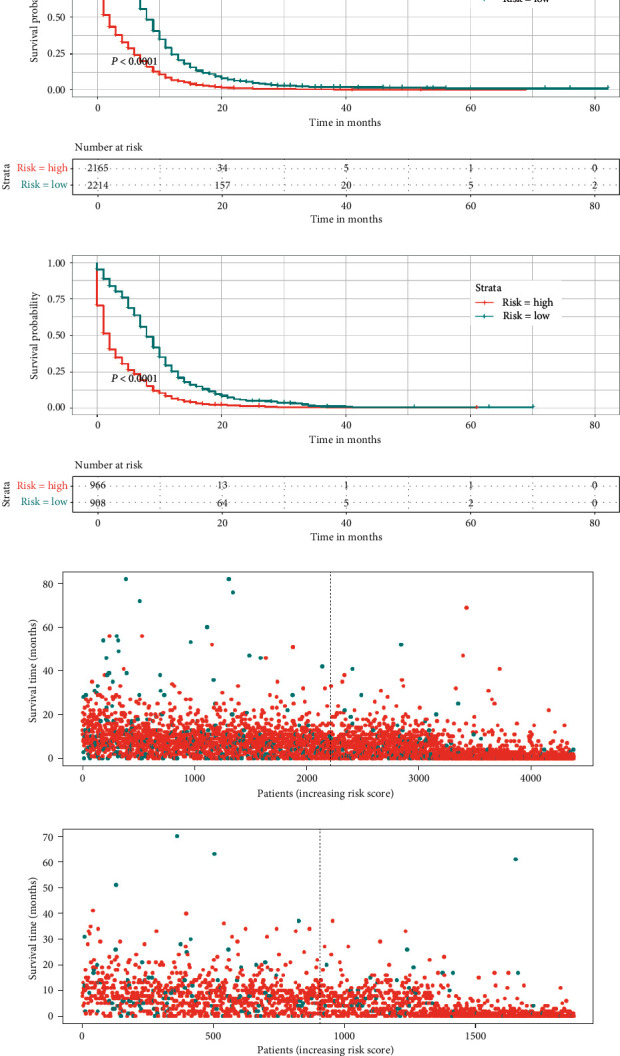
Kaplan–Meier survival analysis of the signature for both the training cohort and the validation cohort. Patients in the training cohort ((a), (c)) and validation cohort ((b), (d)) with a higher risk score demonstrated a worse OS than those with a lower risk score, which suggests the strong predictive ability of the nomogram for the survival outcomes of patients with BM.