
Figure 8.
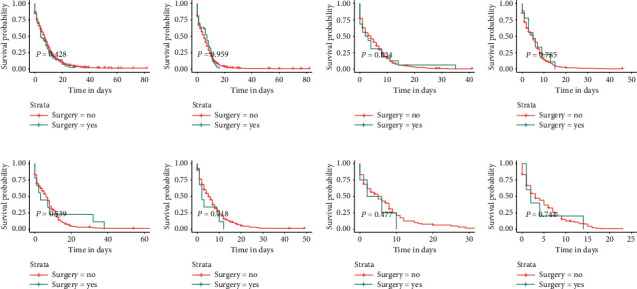
Kaplan–Meier survival curves and log-rank tests for each patient subgroup based on treatment modality. Differences in OS between patients who underwent surgery and those who did not in each subgroup. (a) Bone-only. (b) Bone and liver. (c) Bone, lung, and, liver. (d) Bone, liver, and brain. (e) Bone and lung. (f) Bone and brain. (g) Bone, lung, and brain. (h) Bone, lung, liver, and brain.