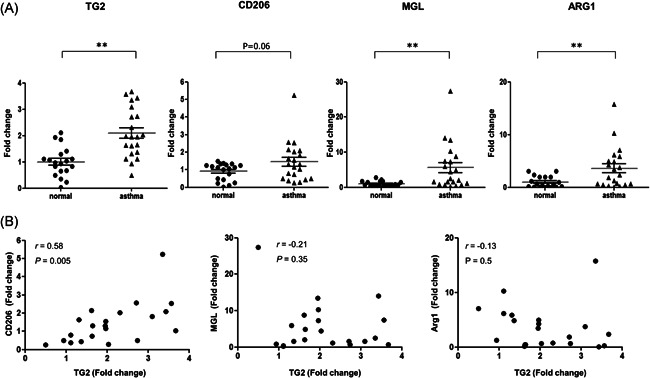
Figure 1.

mRNA expression of TG2 and M2 macrophage markers in human induced sputum samples. The mRNA levels of TG2, CD206, MGL, and ARG1 in induced sputum of asthmatic patients compared with those of healthy controls (A, 21 asthmatics and 19 asymptomatic healthy controls). Fold change values presented in the Y‐axis of each graph. Correlation between sputum CD206 and TG2 expression, between sputum MGL and TG2 expression, and between sputum Arg1 and TG2 expression (B). Correlation coefficients (r) were measured using Pearson's method. MGL, macrophage galactose‐type C‐type lectin 1; TG2, Transglutaminase 2. *p < .05. **p < .01
