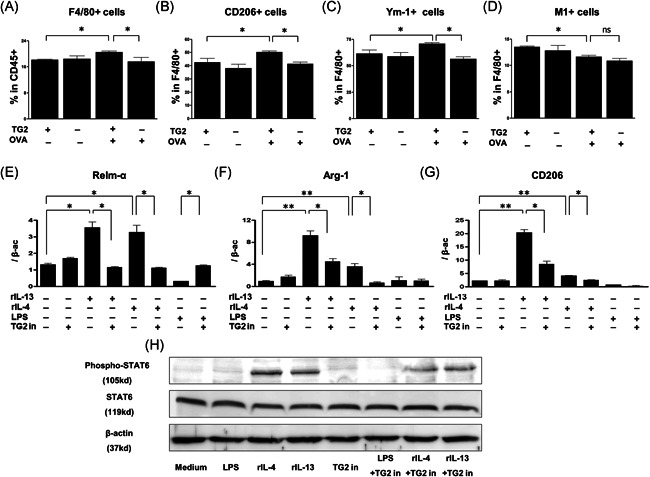
Figure 4.

Effects of TG2 on the expression of M2 macrophage markers in mouse lung tissue and alveolar macrophages. (A–D) The expression of M2 macrophage markers was measured by FACS in TG2 null mice and WT mice after OVA sensitization and challenge (n = 5‐6 mice per group). The proportion of F4/80+ macrophages in CD45+ cells (A), F4/80+ macrophage expressing CD206 (B), Ym‐1 (C), and CD11c+CD206− (M1) (D) are depicted. The mRNA levels of Relm‐α (E), Arg‐1 (F), and CD206 (G) in Th2 cytokine (20 ng/ml)‐stimulated mouse alveolar macrophages were compared according to the TG2 inhibitor treatment (100 μg/ml). Experiments were performed at least three times. The levels of mRNA are expressed as a ratio with β‐actin. Western blot analysis of phospho‐STAT6, total STAT6, and β‐actin expression in Th2 cytokine‐stimulated mouse alveolar macrophages were compared with or without a TG2 inhibitor (H). % Area of phospho‐STAT6 was measured by ImageJ. FACS, fluorescence‐activated cell sorting; OVA, ovalbumin; WT, wild type; STAT, signal transducer and activator of transcription; Tg2, transglutaminase 2. *p < .05, **p < .01
