
Figure 1.
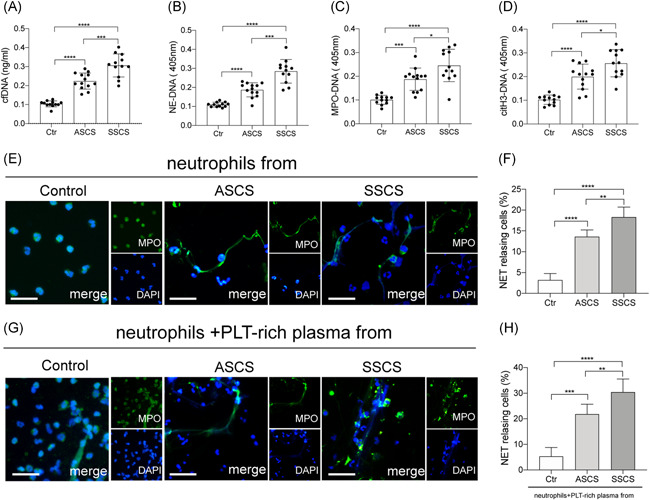
The plasma levels of NET markers increased in symptomatic patients. The NET markers, (A) cfDNA, (B) NE‐DNA, (C) MPO‐DNA, and (D) citH3‐DNA were measured in plasma samples from healthy subjects (n = 12), symptomatic patients (n = 13), and asymptomatic patients (n = 12). (E) Neutrophils from healthy subjects, symptomatic and asymptomatic patients were stained using MPO (green) and DAPI (blue) then analyzed through confocal microscopy. (F) The rate of NETosing neutrophils from each group of patients. (G) Control neutrophils were incubated from PLT‐rich plasma from healthy subjects, symptomatic and asymptomatic patients were stained using MPO (green) and DAPI (blue) then analyzed through confocal microscopy. (H) The rate of NETosing neutrophils from each group of patients. The inset scale bar in E and G are 20 μm. Data are presented as the mean ± SD. cfDNA, cell‐free DNA; citH3‐DNA, citrullinated histone H3‐DNA; DAPI, 4',6‐diamidino‐2‐phenylindole; MPO‐DNA, myeloperoxidase‐DNA; NE‐DNA, neutrophil elastase‐DNA; NET, neutrophil extracellular trap; PLT, platlets. *p < .05, **p < .01, ***p < .001 and ****p < .0001