Figure 7.

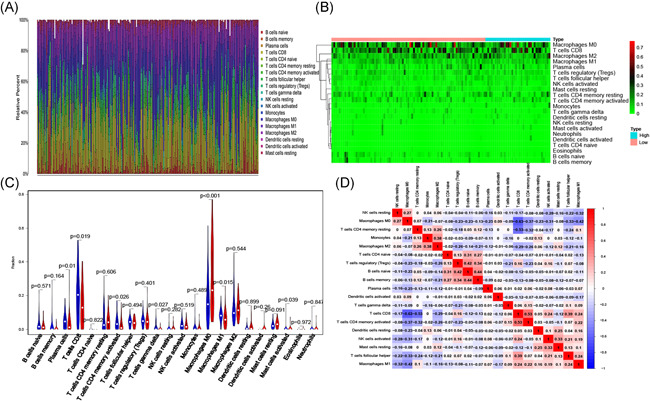
The proportion (A) and heatmap (B) of 22 immune cells in the training cohort. The comparison of 22 immune cells between two groups (low‐risk (green) vs. high‐risk (red)) (C). Correlation analysis of 22 immune cells (D)

The proportion (A) and heatmap (B) of 22 immune cells in the training cohort. The comparison of 22 immune cells between two groups (low‐risk (green) vs. high‐risk (red)) (C). Correlation analysis of 22 immune cells (D)