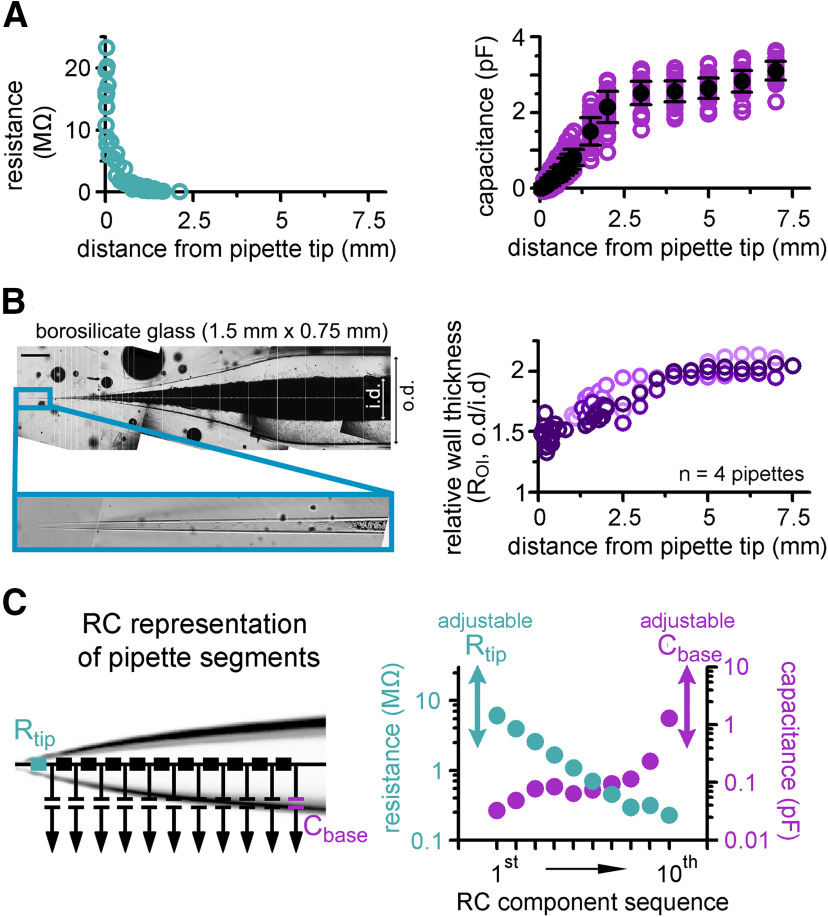
Figure 3.
Implementation of pipettes with non-uniform Cpip and Rpip distributions. A, Pooled data of Rpip (left graph) and Cpip (right graph) as a function of tip distance. B, A representative imaging plane that was used for the measurement of the relative wall-thickness (ROI) that is, the ratio of outer and inner diameter (o.d. and i.d., respectively) of the pipettes. Scale bar: 0.5 mm. Graph on the right shows that the wall of the pipettes is much thinner toward the tips (i.e., the i.d. is larger than predicted from the Roi of the original glass; the four measured pipettes are shown in different shades of purple). C, Pipettes were implemented as 10 independent RC units, a resistor (Rtip, on the left) and a capacitor (Cbase, on the right). The two latter components allow the adjustment of the model to fit the differences of Rpip and Cpip of individual pipettes. Graph on the right indicates the actual capacitance (purple) and resistance (green) values of the 10 fixed RC motifs.

