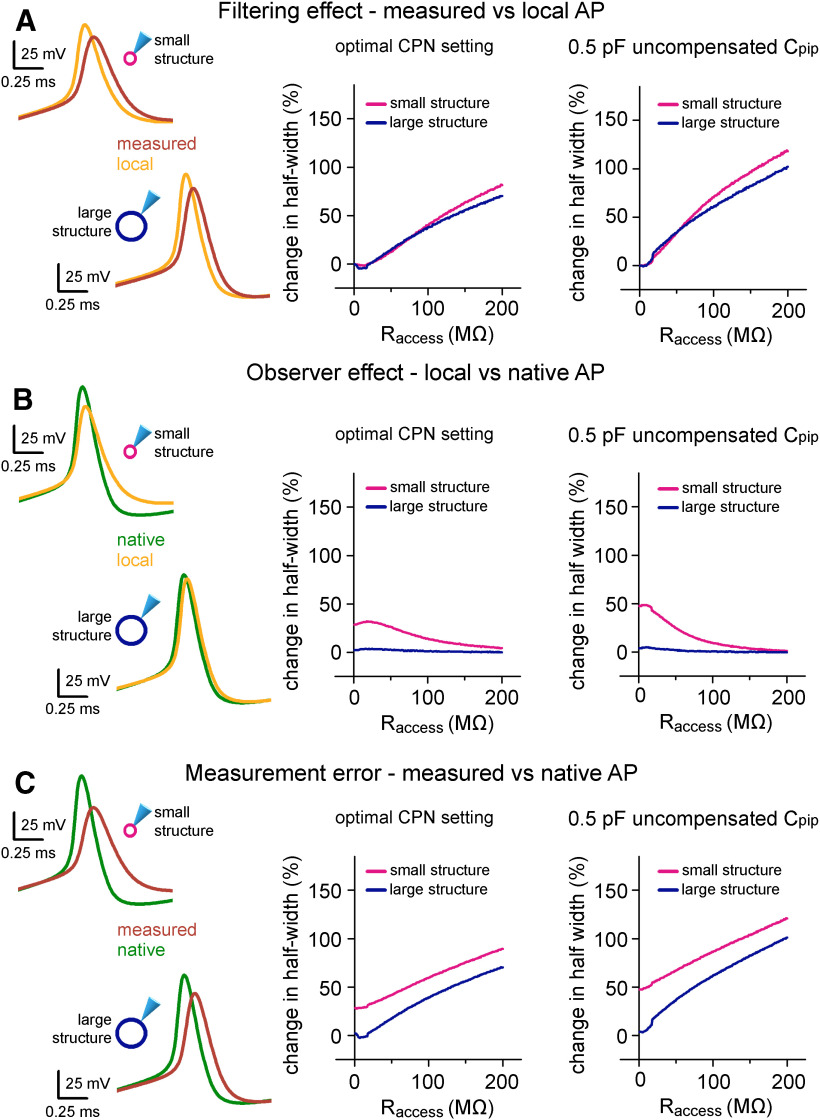
Figure 7.
Instrumental and structural parameters cooperatively determine signal distortions in recordings from small neuronal structures. A, On the left, the differences between the waveforms of the same APs within the pipette (measured) and in the two hypothetical cells (local) highlight the filtering effect of 60-MΩ Raccess. Only the size of the membrane surface was different in the two spherical structures, resulting in 1- and 10-pF biological capacitance, which correspond to small axonal and small somatic recordings. Graph in the middle summarizes the filtering effect quantified as the difference in AP half-width over a wide range of Raccess in the small and large spherical cells. The right graph summarizes the filtering effect in simulations where suboptimal CPN was applied (6.3 pF instead of 6.8 pF). The effect of filtering on the AP amplitude is shown in Extended Data Figure 7-1A. B, Using the same simulation environment as in panel A, the observer effect was quantified as the difference between the local AP and the native AP waveform. Thus, these data represent the isolated influence of the instrument on local signal generation. See also Extended Data Figure 7-1B. C, To quantify the measurement error, we demonstrate the difference between the measured AP and the native AP waveform in the same conditions as above. Thus, this is the sum of the filtering and observer effects. See also Extended Data Figure 7-1C.

