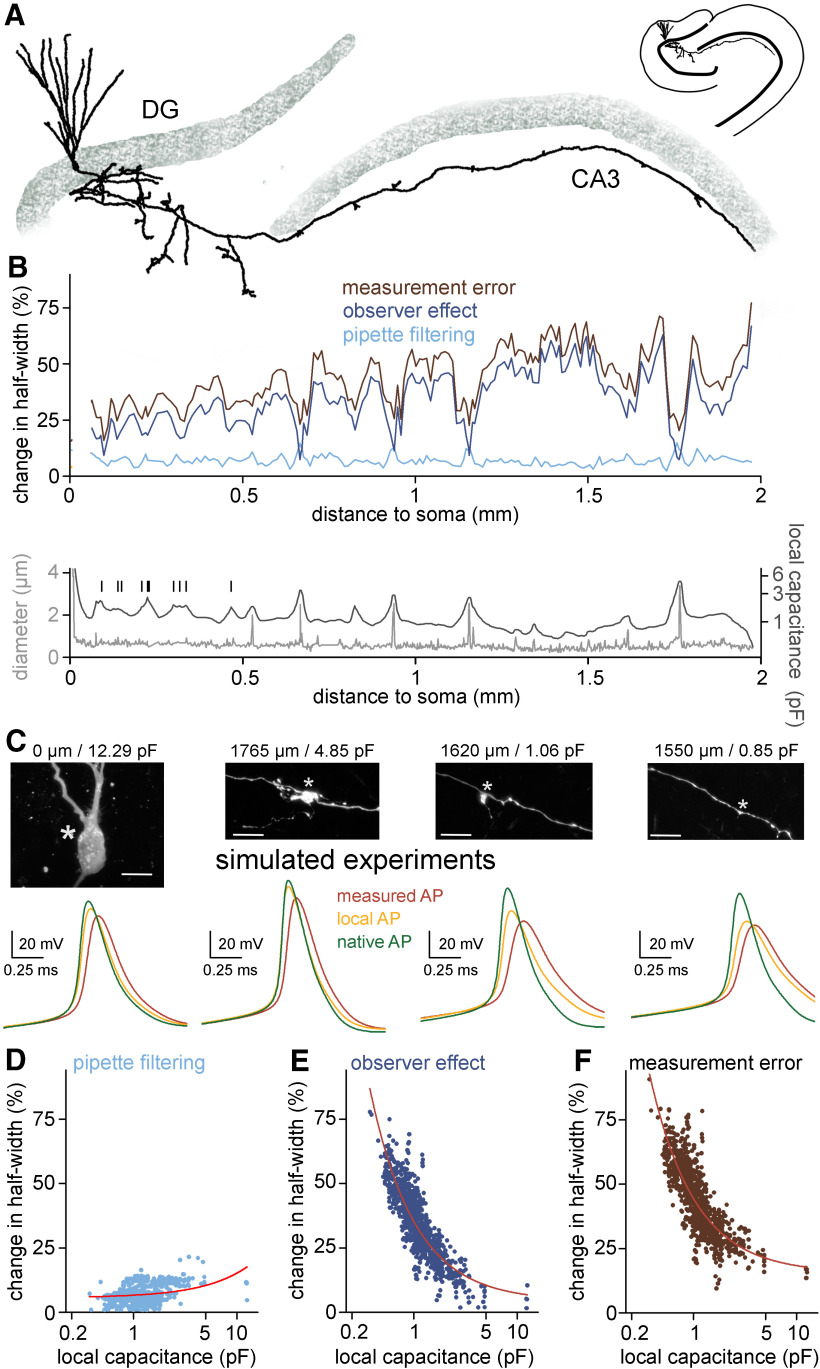
Figure 8.
Measurement error along the axon is inhomogeneous and depends on the local biophysical environment. A, Morphology of a somatically labeled complete granule cell that was used for simulating hypothetical recordings along its axon. B, top, Observer and filtering effects (dark blue and light blue, respectively) together with the overall measurement error (brown) in simulated axonal measurements plotted against the somatic distance of the recording position. Each value represent average of five individual measurements in each 10-μm segments. Bottom, Axonal diameter (gray) and local capacitance (black) as a function of somatic distance. Vertical bars indicate the branch points of hilar axon collaterals. Notice that signals that derive from axonal segments that are closer to the soma are less affected by the observer effect because of the capacitive “load” of the somatic membrane. C, Representative simulated recordings from the soma and different axonal sites and confocal images of the simulated recording site (same cell as in panel A). Corresponding somatic distances and local capacitances are indicated on the top. Asterisks mark the recording positions in the simulations. Scale bar: 10 μm. D, The filtering effect showed only weak correlation with the local axonal capacitance (n = 941 simulated recordings, R2 = 0.13, linear fit). Circles represent the filtering effect at independent measurement sites along the same axon. Note the logarithmic scale of the x-axis. E, The observer effect showed significant correlation with local axonal capacitance (n = 941 simulated recordings, R2 = 0.75, fitted with power function). F, Correlation between the total measurement error and the local axonal capacitance (n = 941 simulated recordings, R2 = 0.68, fitted with power function).

