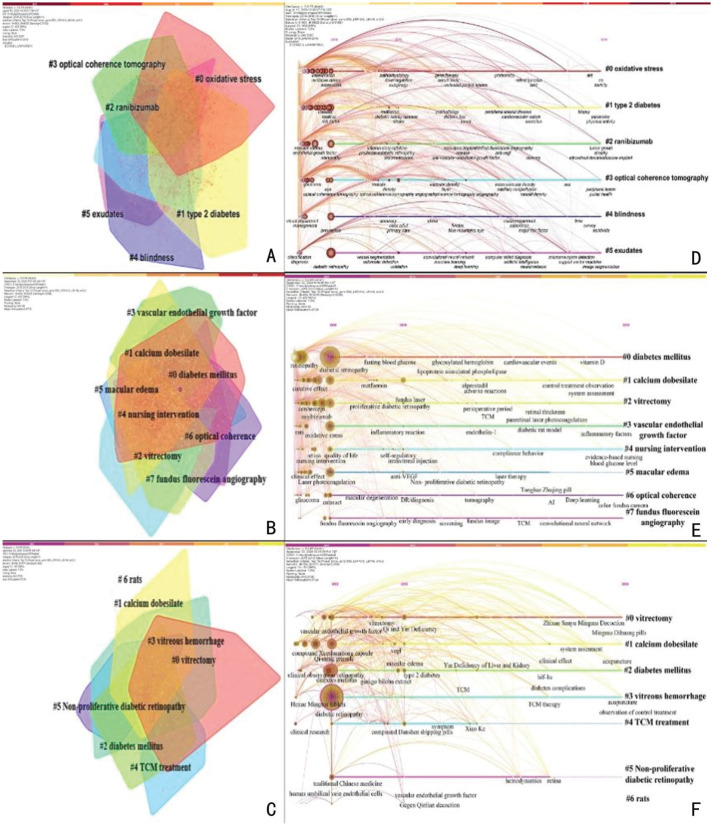
Figure 6. Map of keywords clustering of DR research from 2015 to 2019.
A: The cluster views of English co-keywords analysis; B: The cluster views of Chinese co-keywords analysis; C: The cluster views of TCM co-keywords analysis (The convex hulls of different colors represent different clusters; the brighter the convex hull is, the more recently it appears. The number of nodes each convex hull covers is proportional to the number of keywords of each cluster. The thickness of line each convex hull covers is proportional to the co-occurrence frequency of keyword of each cluster.); D: The timeline view of English co-keywords analysis; E: The timeline view of Chinese co-keywords; F: The timeline view of TCM co-keywords (Time is set as the horizontal axis, and the cluster is set as the vertical axis. This view clearly presents the differences in the appearance time point and time span of each cluster.).

