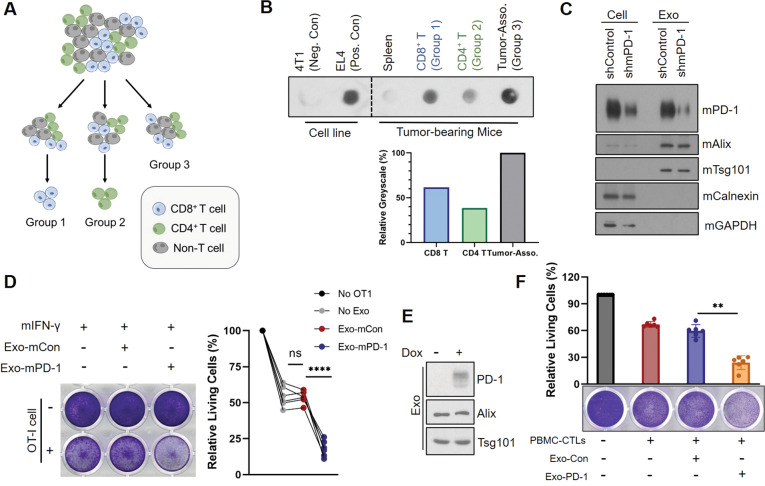
Fig. 2. Exo-PD-1 enhances the killing capacity of cytotoxic T lymphocytes in vitro.
A Illustration showing the grouping of exosome-donor cells from which exosomes used in B were derived. Single cells isolated from 4T1 tumors were equally divided into three groups. CD8+ T cells were isolated from Group 1 (blue cells), CD4+ T cells were isolated from Group 2 (green cells), and no isolation was performed in Group 3 to mimic original cellular microenvironment within the tumors. B Immunoblots (upper) and relative greyscale value quantification of exosomal PD-1 expression in 4T1 tumor-bearing splenic cells, CD8+ and CD4+ tumor-infiltrating T lymphocytes (Group 1 and Group 2, respectively), and tumor-associated cells (Group 3). The value of Group 3 was set as 100% for comparison. Exosomes from 4T1 cells were used as the negative control, and exosomes from EL4 cells as the positive control to validate anti-mPD-1 antibody specificity. C Immunoblot of cellular and exosomal mPD-1 in wild-type and mPD-1 knockdown mouse EL4-T cell lines. Exosomes from EL4-shmPD-1 were used as Exo-mCon and exosomes from EL4-shControl as Exo-mPD-1 in the following experiments. mAlix, mTsg101, mouse exosome markers. mCalnexin, mGAPDH, mouse cell plasma markers. D Representative crystal violet staining images (left) and absorption quantification (right) of remaining living PY8119-OVA cells after co-culture with OT-I cells in the absence or presence of Exo-mCon or Exo-mPD-1 for 2 days. Each curve represents one independent experiment (n = 6). ns no statistical significance. ****P < 0.00005. E Immunoblot of cellular and exosomal PD-1 expression in doxycycline-inducible Jurkat-PD-1 cells. F Crystal violet staining images (lower) and absorption quantification (upper) of remaining living BT549-PD-L1−/− cells after PBMC-T cell killing in the presence of Exo-Con or Exo-PD-1 for 2 days (n = 6). **P < 0.005.

