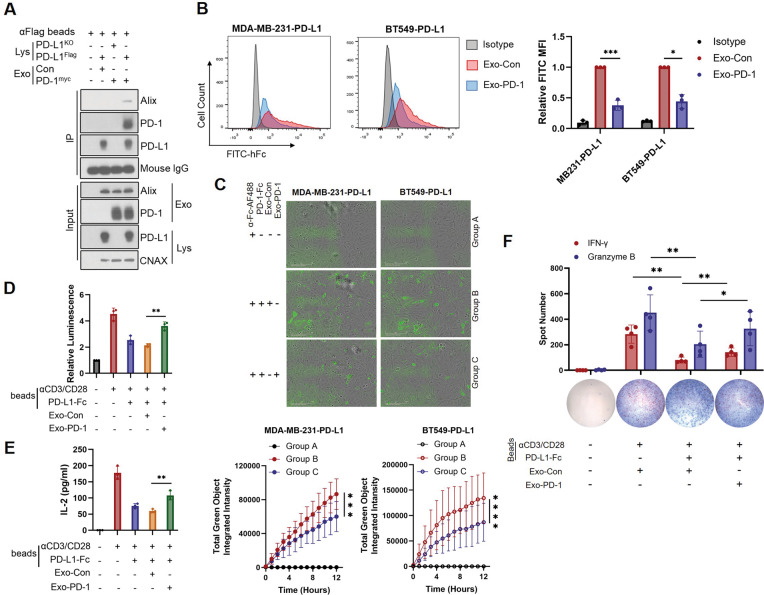
Fig. 3. Exo-PD-1 binds cell surface PD-L1.
A Immunoprecipitation and western blots showing the interaction between exosomal PD-1 and cellular PD-L1. B Representative flow cytometry images (left) and quantitative analysis (right) of cell surface interacted rhPD-1-Fc level in Exo-Con or Exo-PD-1-treated PD-L1-overexpression breast cancer cells (n = 3). *P < 0.05, ***P < 0.0005. C Time-lapse evaluation and quantification of the dynamic interaction between Alexa FluoTM 488-labeled rhPD-1-Fc (green) and surface PD-L1 in breast cancer cells in the presence of Exo-Con or Exo-PD-1 treatment for 12 h (n = 3). ***P < 0.0005, ****P < 0.00005. D Normalized luminescence of Exo-Con or Exo-PD-1 pretreated stimulatory (anti-CD3/CD28/IgG) or inhibitory (anti-CD3/CD28/PD-L1) bead-stimulated Jurkat-PD-1-NFAT-Luciferase reporter cells for 24 h (n = 3). E Quantification of IL-2 secreted by Jurkat-PD-1 cells stimulated with stimulatory (anti-CD3/CD28/IgG) or inhibitory (anti-CD3/CD28/PD-L1) beads pre-incubated with Exo-Con or Exo-PD-1 (n = 3). **P < 0.005. F ImmunoSpot microscopy images and spot quantification of stimulatory (anti-CD3/CD28/IgG) or inhibitory (anti-CD3/CD28/PD-L1) bead-stimulated PBMC-T cell-released IFN-γ (red) and granzyme B (blue) particles in the presence of Exo-Con or Exo-PD-1 (n = 4). *P < 0.05, **P < 0.005.

