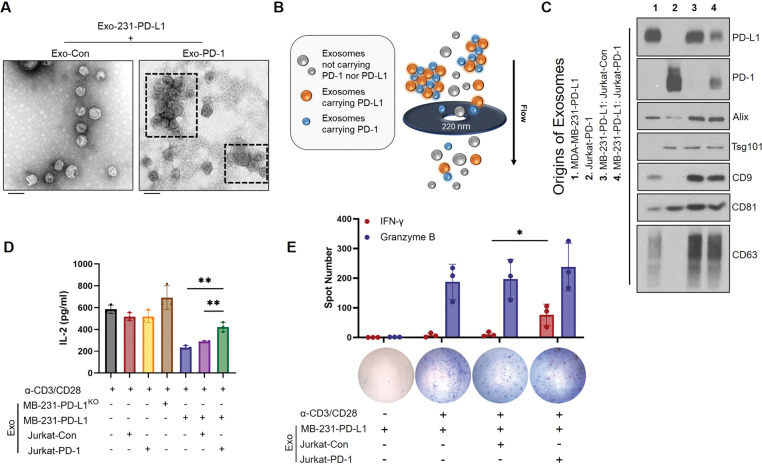
Fig. 5. Exo-PD-1 neutralizes Exo-PD-L1-induced T cell dysfunction by forming exosomal clusters.
A TEM images of mixtures of exosomes derived from MDA-MB-231-PD-L1 with Exo-Con (left) and Exo-PD-1 (right). Clusters of exosomes are shown within dashed frames. Scale bar, 100 nm. B Illustration showing that large Exo-PD-L1: Exo-PD-1 clusters are impeded and excluded by 0.22 μm filter pores. C Immunoblot of exosomal PD-1, PD-L1, and exosome markers (Alix, Tsg101, CD9, CD81, CD63) of exosomes isolated from the culture supernatants of indicated four groups (left). D Quantification of IL-2 secreted by activated PBMC-T cells treated with diverse groups of exosomes as indicated (n = 3). **P < 0.005. E ELISPOT images and spot quantification of activated PBMC-T cell-released IFN-γ (red) and granzyme B (blue) particles with diverse exosomal treatments as indicated (n = 3). *P < 0.05.

