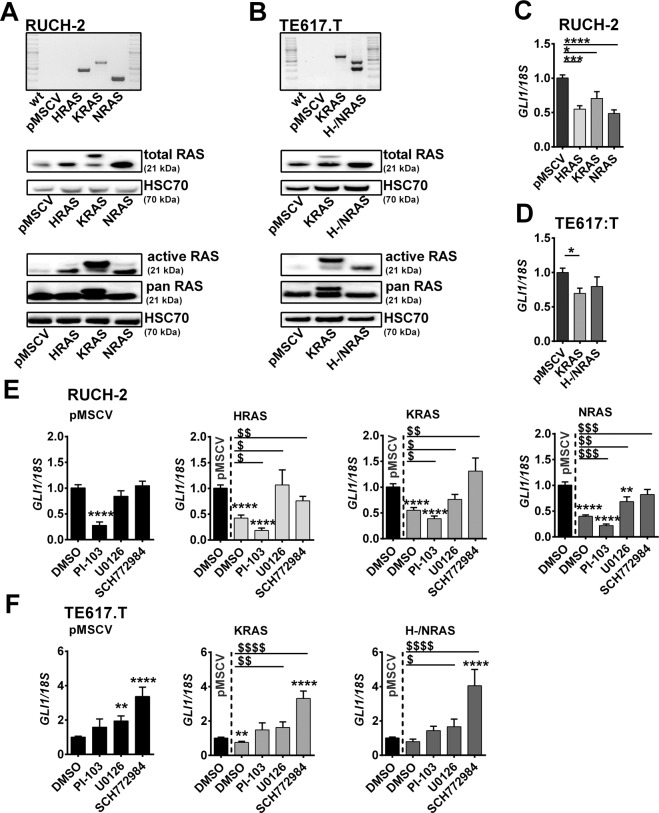
Fig. 1. Impact of oncRAS mutations on GLI1 expression in RUCH-2 and TE617.T ERMS cells.
A, B Expression of HRAS, KRAS, NRAS, or pMSCV was confirmed by RT-PCR on cDNA level (top), western blot analyses for RAS protein (middle) and RAS activity by RAS-GTP pulldown assay (n = 2, bottom) in (A) RUCH-2 and (B) TE617.T cell lines. HSC70 was used as loading control. C, D GLI1 qRT-PCR analyses of (C) HRAS-, KRAS-, NRAS-expressing RUCH-2 and (D) KRAS- or H-/NRAS-expressing TE617.T cells compared to respective pMSCV control cells. E, F GLI1 qRT-PCR analyses of (E) HRAS-, KRAS- or NRAS-expressing RUCH-2 and F KRAS- or H-/NRAS-expressing TE617.T cells treated with 3 µM PI-103-, 10 µM U0126- or 0.5 µM SCH772984 compared to pMSCV cells. DMSO-treated (1 µl/ml) cells served as controls. Data are shown as fold induction over the expression level of solvent-treated pMSCV control cells, which was set to 1. Bars show mean + SEM. * or $: significant compared to solvent-treated pMSCV control or solvent-treated oncRAS cell line tested by Mann–Whitney test. */$ p < 0.05, **/$$ p < 0.01, ***/$$$ p < 0.001, ****/$$$$ p < 0.0001.

