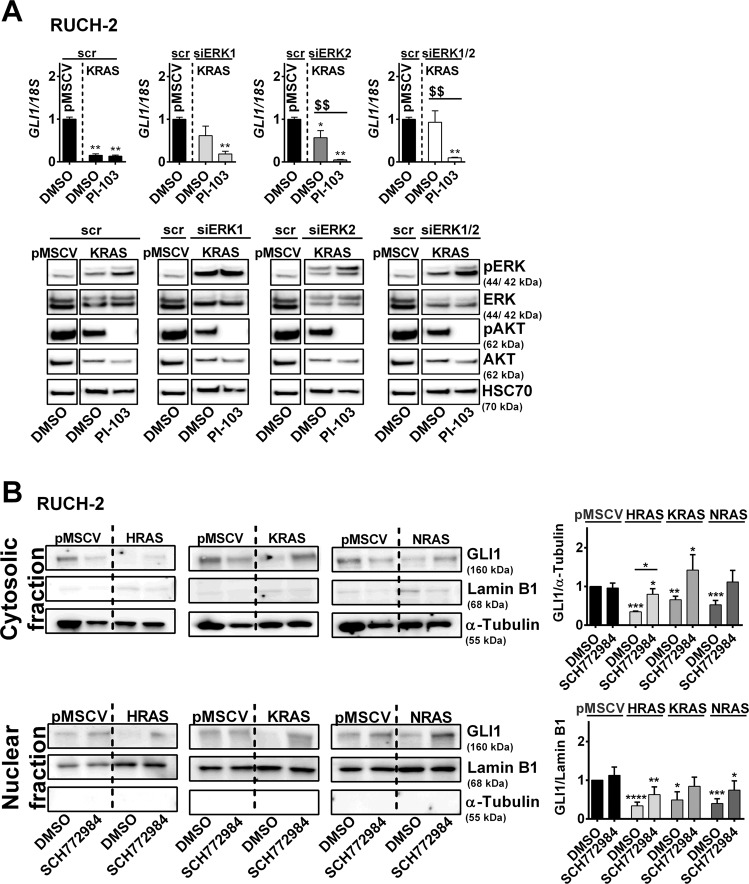
Fig. 2. Impact of ERK on GLI1 expression in RUCH-2 cells.
A GLI1 expression (top) and representative pERK/ERK and pAKT/AKT western blot analyses (bottom) (n = 2) of KRAS-expressing RUCH-2 cells after siRNA (100 nM each)-mediated ERK1 and/or ERK2 knockdown with and without PI-103 treatment (3 µM) compared to scramble (scr) siRNA transfected KRAS-expressing RUCH-2 and pMSCV control cells. HSC70 served as loading control. B Representative western blot analyses (n = 5) (left) and respective densitometric analyses (right) of GLI1 expression in cytosolic and nuclear fractions of HRAS-, KRAS- and NRAS-expressing RUCH-2 cells with or without SCH772984 treatment in comparison to solvent-treated pMSCV control. Lamin B1 or α-Tubulin served as loading controls for nuclear or cytosolic fractions, respectively. Bars: mean + SEM. * or $: significant compared to solvent-treated pMSCV control or solvent-treated oncRAS cell line tested by Mann–Whitney test. */$ p < 0.05, **/$$ p < 0.01, ***/$$$ p < 0.001, ****/$$$$ p < 0.0001.

