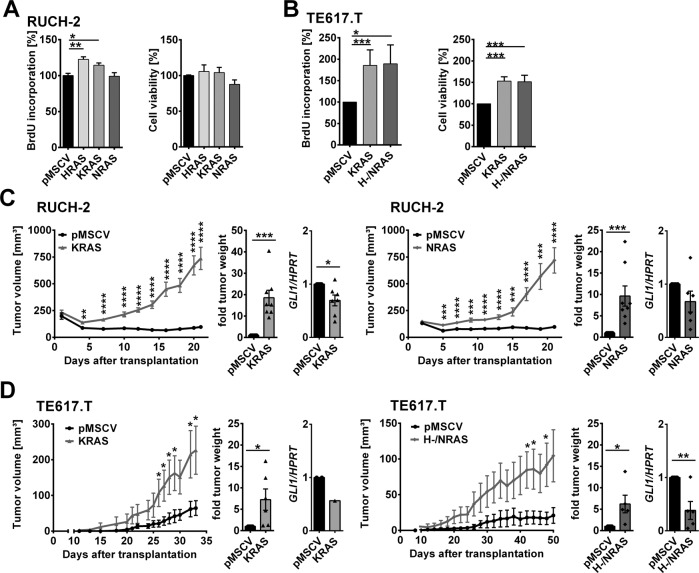
Fig. 3. Impact of oncRAS on growth of RUCH-2 and TE617.T cells and on GLI1 expression after xenotransplantation.
A, B BrdU-incorporation (left) and WST-1 cell viability (right) assays of A RUCH-2 (n = 3) and B TE617.T (n = 7) cells stably expressing HRAS, KRAS, NRAS or H-/NRAS. C, D Mean tumor volume (±SEM), -fold tumor weight and -fold GLI1 expression of C RUCH-2 and D TE617.T xenotransplants expressing KRAS (n = 8 mice), NRAS (n = 8 mice) or H-/NRAS (n = 6 mice) compared to respective pMSCV control tumors of the same mice (controls were all set to 1 for -fold tumor weight and -fold GLI1 expression). Bars: mean + SEM. *Significant by multiple unpaired t-test (tumor growth curve) or Mann–Whitney test (BrdU and WST assay, tumor weight, GLI1 expression) in comparison to pMSCV controls. *p < 0.05, **p < 0.01, ***p < 0.001, ****p < 0.0001.

