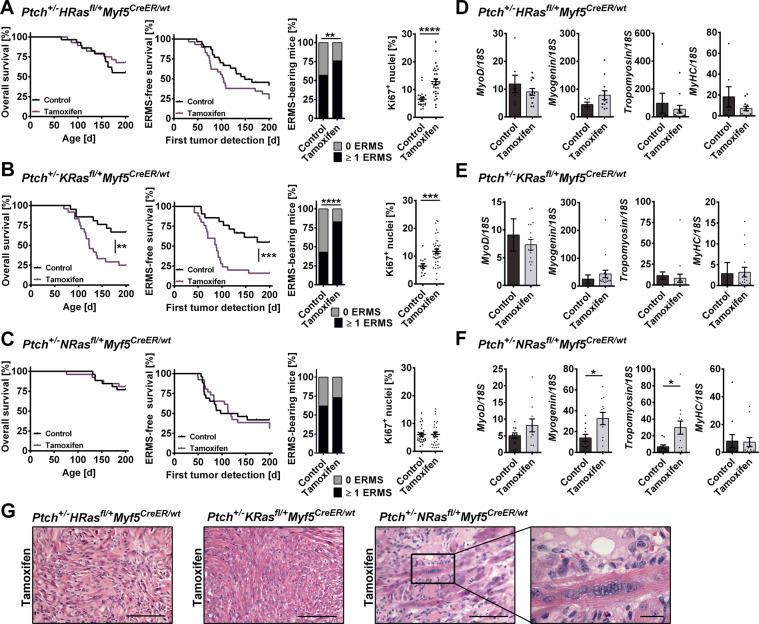
Fig. 5. Impact of oncRAS mutations on progression and differentiation of ERMS precursors in Ptch+/− mice.
A–C ERMS development in A Ptch+/−HRasfl/+Myf5CreER/wt, B Ptch+/−KRasfl/+Myf5CreER/wt or C Ptch+/−NRasfl/+Myf5CreER/wt mice injected with tamoxifen at an age of 4 weeks in comparison to the control. Numbers of animals and tumors included in the experiments are given in Table 1. From left to right: overall survival, ERMS-free survival (only palpable ERMS), total ERMS incidence (palpable and non-palpable ERMS) and percentage of Ki67+ nuclei in ERMS tissue sections. Ki67 staining was done on 10–22 mice of each cohort. Statistical evaluation was done by Log-rank (Mantel–Cox) testing for Kaplan–Meyer curves and by Chi-square testing for tumor incidence. Dots represent the mean percentage of Ki67+ nuclei in individual tumors. D–F qRT-PCR analyses of MyoD, Myogenin, Tropomyosin 3 and Myosin heavy chain (MyHC) in ERMS shown as fold expression of the same gene in normal muscle of the same mouse, which was set to 1. G Representative H&E stainings of ERMS. Close up: multinucleated cells. Scale bars: 100 µm or 20 µm (close up). For all experiments untreated mice served as controls. Bars: mean ± SEM; dots: individual tumors. *p < 0.05, **p < 0.01, ***p < 0.001, ****p < 0.0001 compared to control Ptch+/−oncRasfl/+Myf5CreER/wt mice from the respective cohort and tested by non-parametric t-tests (Mann–Whitney).

