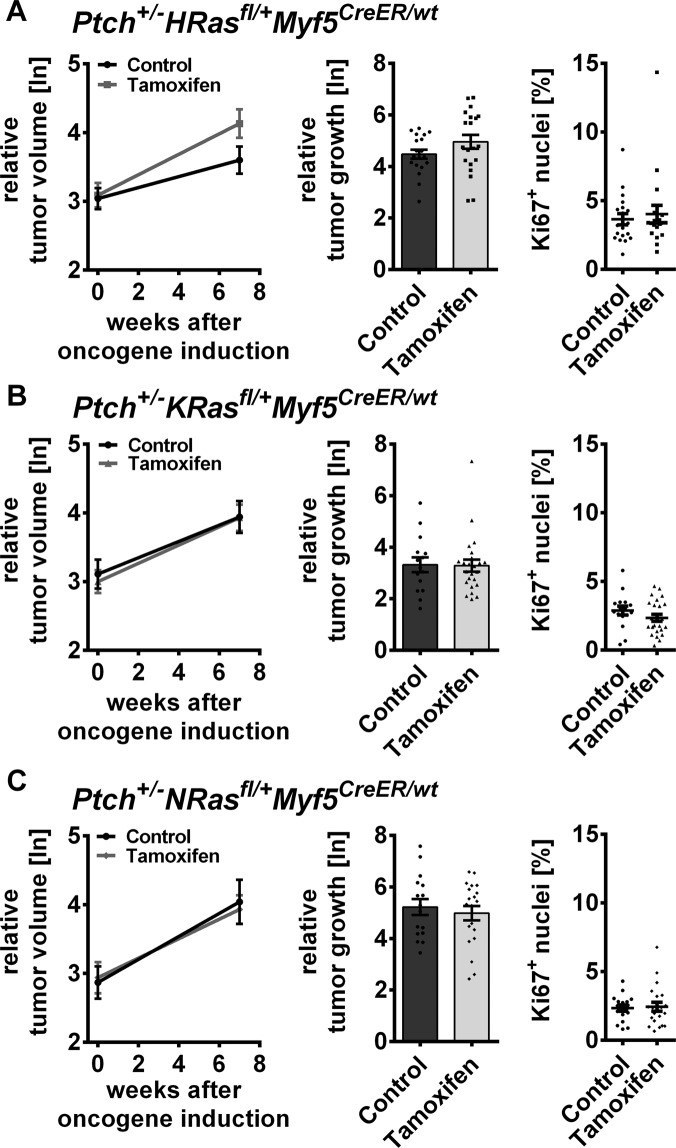
Fig. 6. Influence of oncRAS mutations on established ERMS in Ptch+/− mice.
A–C ERMS growth monitored by µCT measurements before and 7 weeks after tamoxifen-mediated induction of the oncRAS mutations in A Ptch+/−HRasfl/+Myf5CreER/wt B Ptch+/−KRasfl/+Myf5CreER/wt or C Ptch+/−NRasfl/+Myf5CreER/wt mice. At least 12 animals were analyzed per cohort. Left: mean relative tumor volumes before and 7 weeks after injection (ln: logarithmic scale). Middle: relative growth of individual tumors (logarithmic scale). Right: percentage of Ki67+ nuclei in the tumors. Solvent-treated mice served as controls. All ERMS of the same mouse were analyzed as individual tumors. Dots: results for individual tumors. Statistical analyses of mean tumor growth or the individual tumor growth and the percentage of Ki67+ nuclei were done by Student’s t-tests or non-parametric t-tests (Mann–Whitney), respectively.

