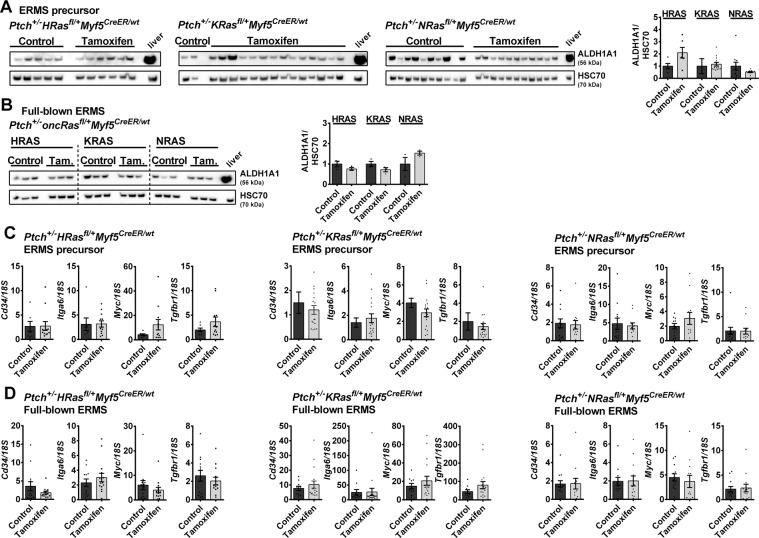
Fig. 7. Expression of stem cell markers in oncRAS-expressing ERMS from Ptch+/− mice.
A, B Representative western blots (left) and respective densitometric analyses (right) for ALDH1A1 protein levels of tamoxifen-treated Ptch+/−HRasfl/+Myf5CreER/wt, Ptch+/−KRasfl/+Myf5CreER/wt, or Ptch+/−NRasfl/+Myf5CreER/wt mice with oncRAS mutations induced at the precursor (A) or the full-blown stage (B) in comparison to control mice. C, D qRT-PCR analyses of Cd34, Itga6, Myc, and Tgfbr1 in ERMS with oncRAS induction at the ERMS precursor stage (C) or at the full-blown ERMS stage (D) shown as fold expression of the same gene in normal muscle of the same mouse, which was set to 1. Dots: values from individual tumors. Statistical evaluation was done by non-parametric t-tests (Mann–Whitney). Bars: mean ± SEM.

