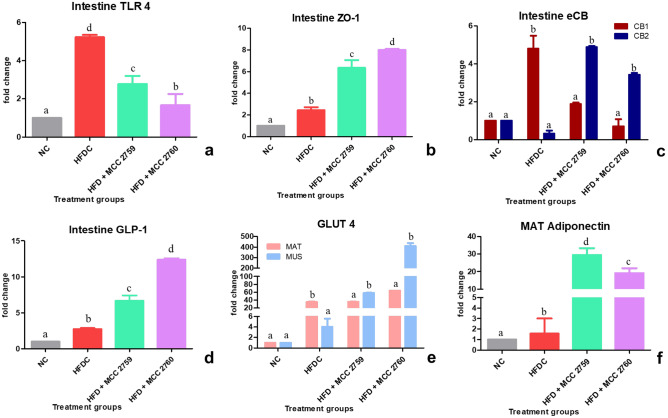
Fig. 4.
Expression changes in intestinal and other markers in high-fat diet fed study groups monitored by qPCR: a TLR4, b ZO-1, c eCB system, d GLP1 intestinal markers, e GLUT4 expression levels in mesenteric adipose tissue and muscle tissue and f adiponectin expression levels in mesenteric adipose tissue. Data presented as mean ± SEM (n = 6). Letters with different superscripts are significant at p < 0.001. The mRNA expression was normalized to GAPDH. NC normal control, HFDC-high-fat diet control, HFD high-fat diet, MCC2759 and MCC2760 L. fermentum spp., MAT mesenteric adipose tissue, MUS muscle

