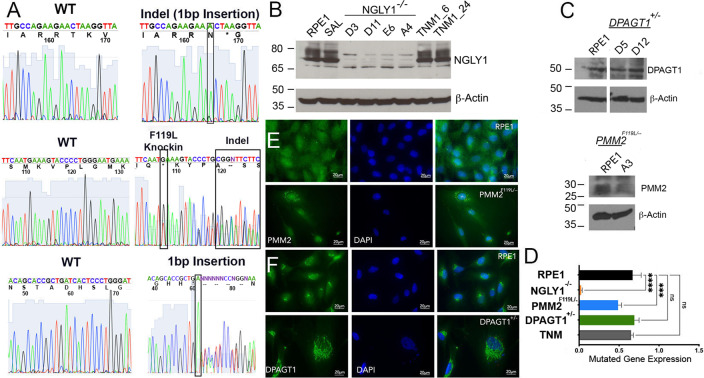
Fig. 1. CDG and CDDG cellular models were validated by Sanger sequencing, immunoblot and immunofluorescence staining for target proteins.
A Electropherogram traces for parental RPE-1 cells, CDDG—NGLY1−/− D11 (top), and CDG—PMM2F119L/−A3 (middle) and DPAGT1+/− D5 (bottom) lines. B, C Representative immunoblot images for target proteins in RPE-1 and isogenic CDDG (B) and CDG (C) lines. RPE-1 cells treated with TNM (1 µM for either 6 h or 24 h) were used as a positive control. D Quantification of the target protein levels in the edited RPE-1 cells (n ≥ 3 per genotype). Expression relative to levels in parental RPE-1 cells. ***P < 0.001, ****P < 0.0001, one-way ANOVA followed by Dunnett multiple comparisons post-test. E, F Representative immunofluorescence images for staining for PMM2 and DPAGT1 in parental RPE-1, CDG—PMM2 F119L/− A3, and CDG DPAGT1+/− D5 lines. Scale bar: 20 µm.

