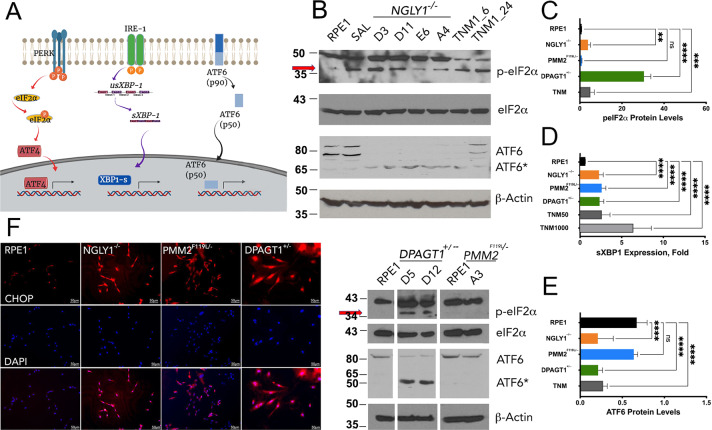
Fig. 2. Cellular models of CDG and CDDG exhibit elevated ER stress responses.
A Schematic of the three major ER stress pathways (analyzed markers are framed). B Representative immunoblot images for ER stress markers in RPE-1 and different clones of isogenic CDDG (top) and CDG (bottom) lines. RPE-1 cells treated with TNM (1 µM for either 6 h or 24 h) and salubrinal (SAL, 50 µM for 24 h) were used as negative and positive controls, respectively. C Quantification of p-eIF2α levels relative to total eIF2α protein (n ≥ 3 per each genotype or treatment). D Expression of spliced XBP1 transcript (n ≥ 10 per each genotype or treatment). E Quantification of ATF6(90) levels in parental and edited RPE-1 cells. (n ≥ 3 per each genotype or treatment). Expression data in C–E are relative to levels in parental RPE-1 cells. *P < 0.05, **P < 0.01, ***P < 0.001, ****P < 0.0001, one-way ANOVA followed by Dunnett multiple comparisons post-test. F Nuclear localization of CHOP/ATF4 in parental and edited RPE-1 cells (scale bars are 50 µm).

