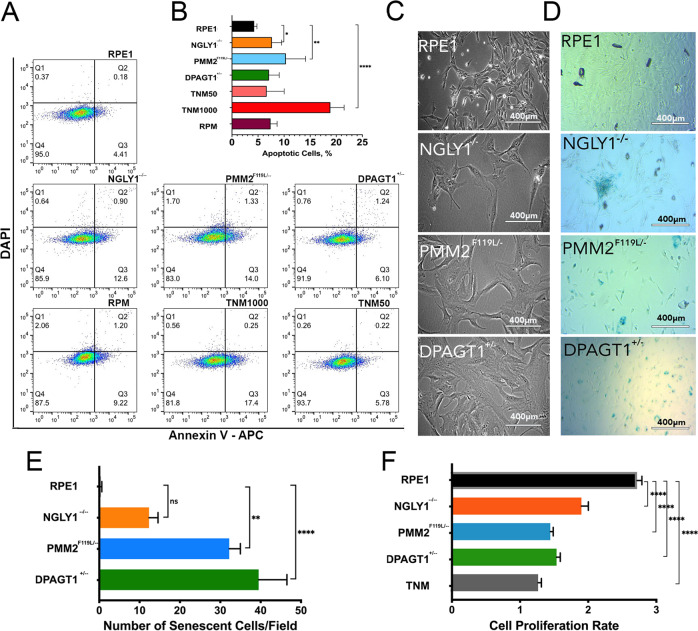
Fig. 3. CDG and CDDG cellular models exhibit low levels of apoptosis, line-dependent levels of senescence and reduced proliferation.
A Representative dot-blots of apoptosis detection (Annexin V staining) in RPE-1, CDG and CDDG lines. Tunicamycin was used as a positive control for apoptosis (1.0 µM, 24 h) and chronic ER stress (0.05 µM, 24 h). Rapamycin treatment (RPM, 500 nM) was used as a control for autophagy induction. B Quantification of apoptosis by flow cytometry (N = 3 experiments). C Representative phase-contrast images of cellular morphology. Scale bars, 400 µm. D Representative images of β-galactosidase senescence staining of parental RPE-1 and CDDG, NGLY1−/− D11, and CDG PMM2 F119L/− A3 and DPAGT1+/− D5 lines. E Quantification of senescence levels as indicated by β-galactosidase staining (10 fields were counted per each genotype). F Quantification of cellular proliferation rates for CDG and CDDG lines relative to parental RPE-1 (n ≥ 10 per each genotype or treatment). To define cell proliferation rate, ratio of OD590 at 72 h to OD590 at 24 h post seeding was calculated. *P < 0.05, **P < 0,01, ****P < 0.0001, one-way ANOVA followed by Dunnett multiple comparisons post-test.

