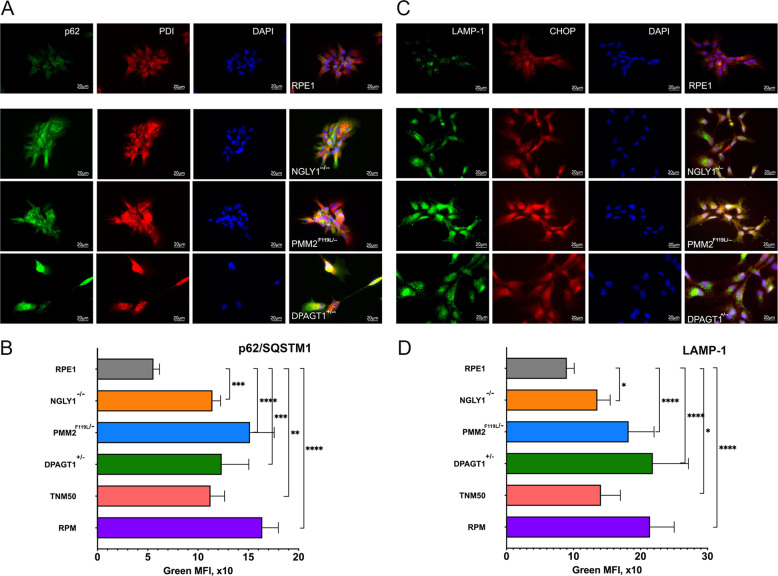
Fig. 4. CDG and CDDG lines exhibit elevated autophagy levels.
Representative immunofluorescence images of parental RPE-1 cells and CDDG and CDG cell lines stained with antibodies against A p62/SQSTM1 or C LAMP1 in combination with anti-CHOP or anti-PDI antibodies, respectively. Scale bar, 20 µm. Quantification of p62/SQSTM1 (B) and LAMP1 (D) staining by flow cytometry (n ≥ 3 per each genotype or treatment). *P < 0.05, **P < 0.01, ***P < 0.001, ****P < 0.0001, one-way ANOVA followed by Dunnett multiple comparisons post-test.

