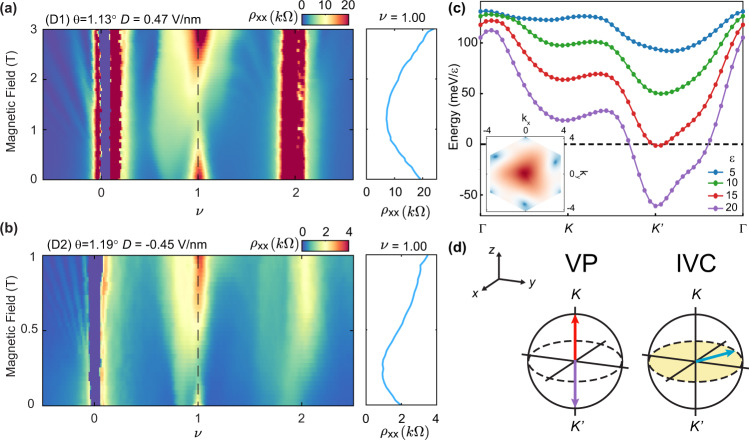
Fig. 2. Magnetic field dependence and ground state ordering of the ν = 1 state.
a, b ρxx as a function of doping and B at T = 0.1 K for D > 0 in device D1 (a) and at T = 0.05 K for D < 0 in device D2 (b). Cuts of ρxx(B) are shown at ν = 1 in the panels to the right of each map, at positions indicated by the black dashed lines in the main panels. Note that ν is the fast sweeping axis in these measurements, and as a consequence, the measured ρxx is substantially smaller than its true value for the insulating states; Supplementary Fig. 8a shows a more faithful measurement of ρxx at ν = 1 in device D1. c Calculated energy of valley magnon formation in tMBG with θ = 1.16∘ at selected values of ϵ. The inset shows the profile of the intervalley exciton, F(k), as a function of crystal momentum in the first Brillouin zone, with the magnitude represented by a log color scale. F(k) ≠ F(−k), indicating that the Q-IVC state breaks TRS. kx,y have units 1/aM, where aM is the moiré lattice constant. d Bloch sphere representation of the VP and IVC states. VP states point towards the north (south) pole for K (K') polarization, as indicated by the red (purple) arrows. IVC states (blue arrow) point along any direction in the x–y plane (shaded).

