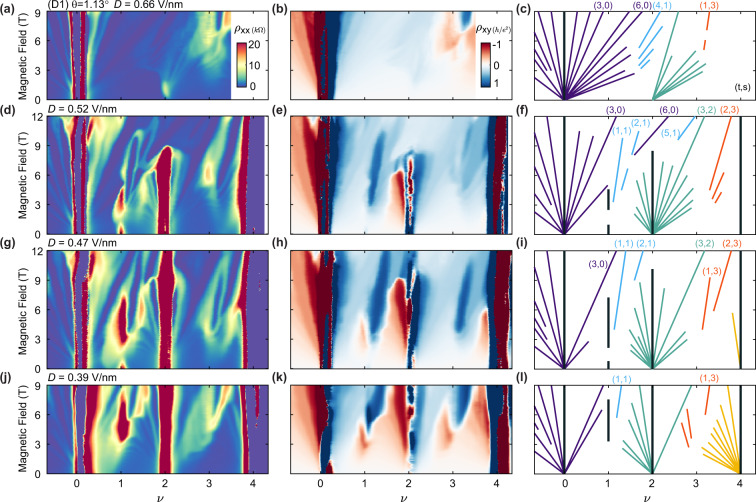
Fig. 3. Landau fan diagrams and spontaneous flavor polarization at the high field for D > 0.
Landau fan diagrams in device D1 at (a, c) D = 0.66 V/nm, (d, f) D = 0.52 V/nm, (g, i) D = 0.47 V/nm, and (j, l) D = 0.39 V/nm, all acquired below T = 0.3 K. The leftmost column shows ρxx, the central column shows ρxy, and the rightmost column schematically denotes the strongest observed gapped states. In the schematic, purple lines correspond to states tracing to ν = 0, blue to ν = 1, green to ν = 2, orange to ν = 3, and yellow to ν = 4. The vertical black lines denote topologically trivial insulating states. Selected states are labeled by their respective (t, s) indices.

