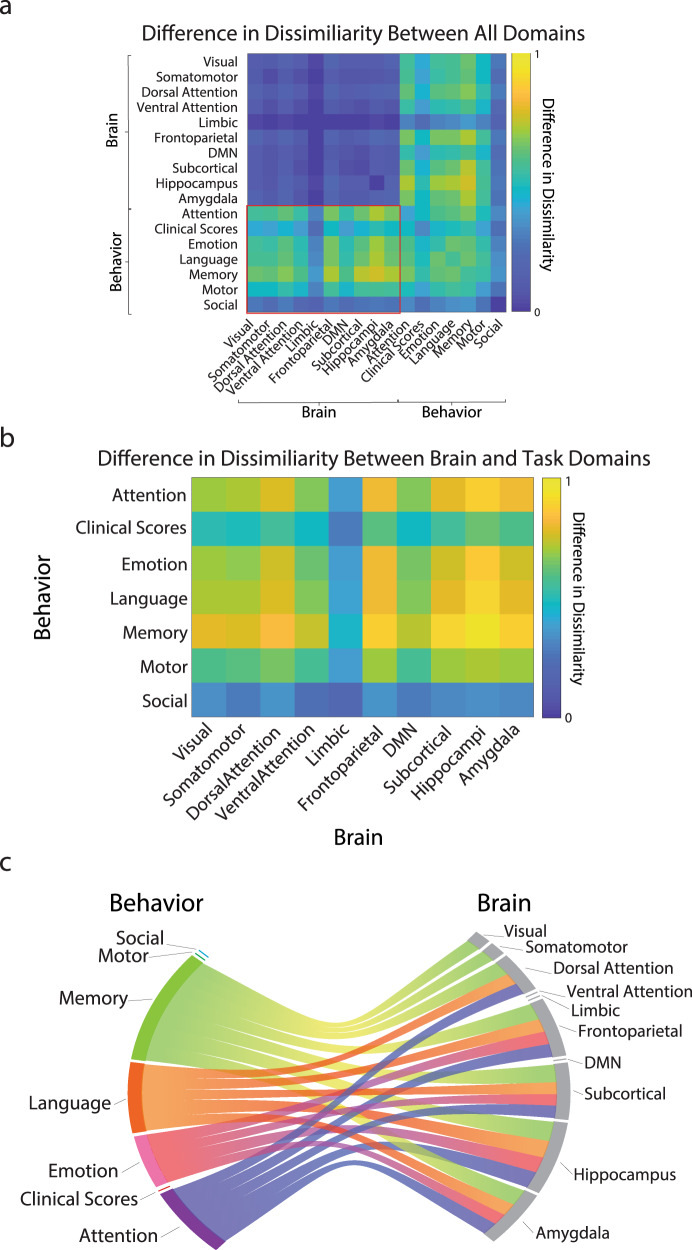
Fig. 5. Difference in representational similarity analysis (RSA) shows many-to-many associations between the modules from the brain networks and behavioral domains.
a Differences in RSA (Sd) between two CCA models (M1 and M2). The values in the matrix Sd represent the difference between S1 and S2. The higher the RSA value, the higher the impact of age. The red rectangle represents the subset of brain-behavior interactions emphasized in (b) (referred to as btn in the main text). b Subset of the multivariate interactions between brain networks and behavioral domains. The data in panel b shows a subset in panel (a) emphasized by the red rectangle, also referred to as btn in the main text. This subset shows the multimodal dissimilarity between brain and behavior domains across the lifespan. c Top quartile of the differences in dissimilarity between brain networks and behavioral domains. This modified chord plot represents the top interactions between the brain networks and behavioral domains in btn. Associations below the 75th percentile were removed from the visualization. Two aspects of the chord plots can be appreciated. First, the number of domains or networks that each network or domain contributes to is shown by the size of the peripheral wedged-segments for each network and domain. The larger the size of the segments, the more contribution of a network (domain) to the various other domains (networks). Second, the associations between each functional network and behavioral domains are described by individual chords (if a chord exists two domains or networks interacted in the CCA).

