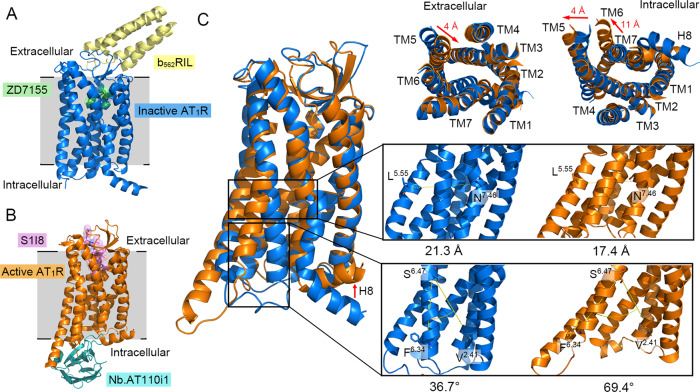
Fig. 1. The distinction between the inactive and fully active AT1 receptor crystal structures.
A The overall structure of the inactive AT1 receptor in complex with an antagonist ZD7155 (green) and b562RIL (yellow). B The overall structure of the fully active AT1 receptor in complex with a partial agonist S1I8 (magenta) and a G protein mimetic nanobody (cyan). C Major conformational changes between the inactive (blue) and fully active (orange) AT1 receptor. Red arrows show obvious transmembrane (TM) movements during activation. The zoom-in views represent the distance between the Cα atoms of L5.55 and N7.46 and the angle among the Cα atoms of F6.34, S6.47, and V2.41, in order to monitor the conformational rearrangements of TMs 5–7. The superscripts refer to the Ballesteros–Weinstein numbering system. All structure figures were drawn by PyMOL. AT1R angiotensin II type 1 receptor, S1I8 S1I8 mutant angiotensin II, Nb Nanobody, TM transmembrane helices, H8 helix 8.

