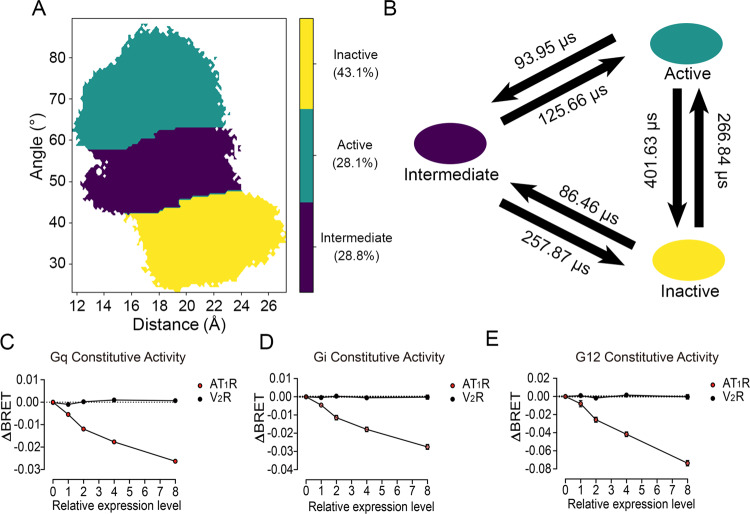
Fig. 3. The three macrostates divided by MSM, and constitutive activity.
A The distribution of active (green), inactive (yellow), and intermediate (purple) states on the free-energy landscape. The attribution and probability of each macrostate are shown on the right. B The transition time among the active (green), inactive (yellow), and intermediate (purple) states, represented by the mean first passage time. Constitutive activities of AT1 receptor in Gq (C), Gi (D), and G12 (E) pathways (red). Vasopressin 2 receptor (V2R) was used as a negative control (black). The gradient cell surface expression levels of AT1 receptor and V2R were achieved by adjusting the transfecting amounts of plasmids encoding the respective receptor in HEK293 cells (Supplementary Fig. 3). Data were from three independent experiments. The bars indicate the mean ± SEM values. The absolute luminescence intensity values are provided in source data. If no special instructions were shown, histograms were drawn by GraphPad. ΔBRET: the change of bioluminescence resonance energy transfer value.

