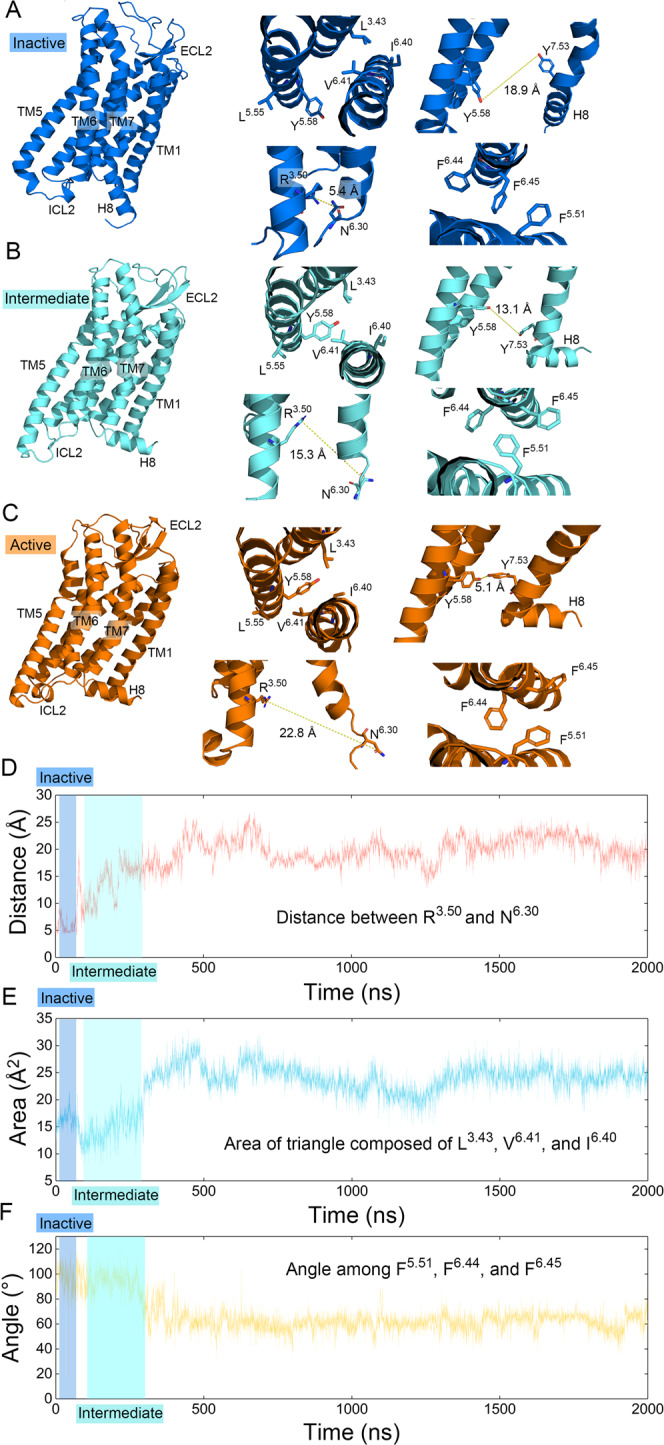
Fig. 4. The synergistic activation mechanism of AT1 receptor.

A–C The comparison of representative inactive (A, blue), intermediate (B, cyan), and active (C, orange) structures. Zoom-in views of key structures are depicted on the right of (A), (B), and (C). Top left: the breaking of hydrophobic lock during activation. Top right: the activation renders the approach of Y7.53 and Y5.58. Bottom left: polar interaction on the position of common ionic lock is broken on the process of activation. Bottom right: F6.44 and F6.45 ratchet past F5.51 with the outward movement of TM6. Distances between atoms are shown in dashed yellow lines. Dynamic variations of these activation properties during a representative simulation trajectory are shown in (D) for the distance between the guanidine carbon atom of R3.50 and the Cγ atom of N6.30 (red), (E) for the area of the triangle composed of the Cγ atom of L3.43, the Cβ atom of V6.41, and the Cβ atom of I6.40 (blue), and (F) for the angle among the centroids of the benzene ring of F5.51, F6.44, and F6.45 (yellow).
