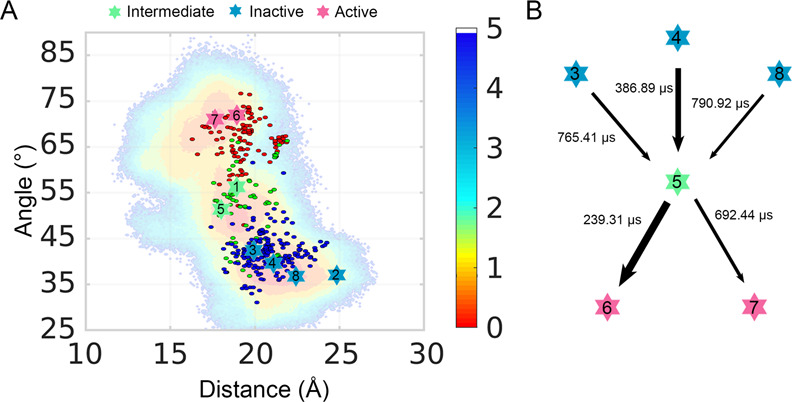
Fig. 6. The eight macrostates clustered by tICA.

A The projection of eight macrostates on the landscape based on their Cα distance between L5.55 and N7.46, and the angle among the Cα atoms of F6.34, S6.47, and V2.41. Color scales of the landscape are shown on the right. B The transition time between the major six structures whose proportions are the most, presented in the form of the activation pathway. The thickness of arrows reflects the transition time. Red, blue, and green stars represent active, inactive, and intermediate macrostates in the two subplots.
