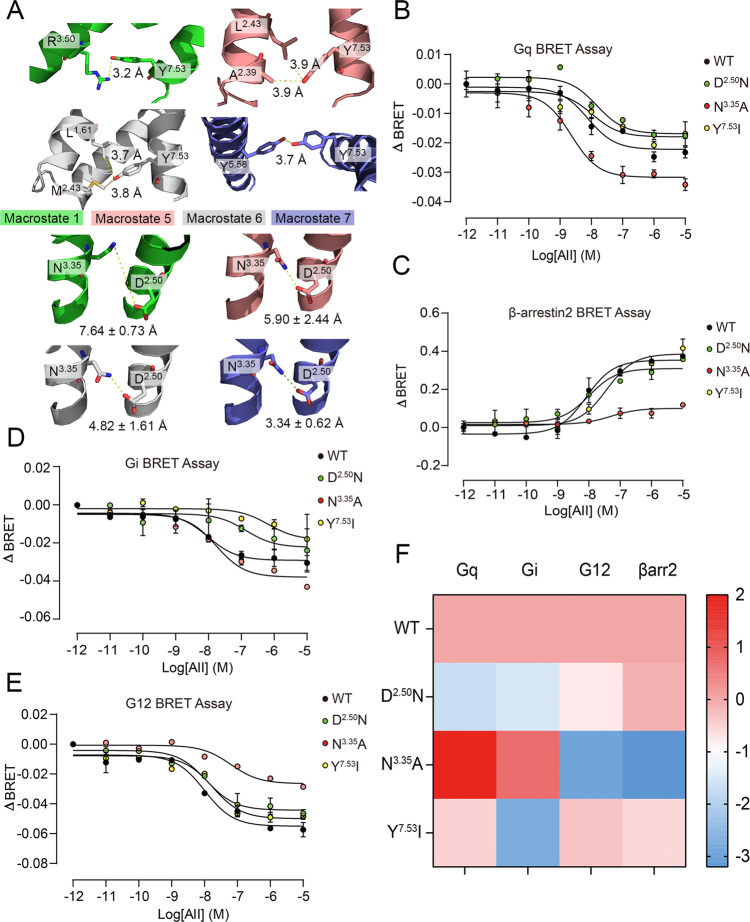
Fig. 7. Different tICA macrostates are responsible for different biased signaling.
A Macrostates 1 (green), 5 (salmon), 6 (gray), and 7 (purple) with their corresponding specific micro-switches are shown in cartoon. Involved residues are shown in sticks. Because of the obvious fluctuation of the distance between N3.35 and D2.50 in representative trajectories of macrostates, the distance is shown in mean ± standard deviation form for all snapshots from the trajectories. AngII-induced Gq activation (B), β-arrestin 2 recruitment (C), Gi activation (D), and G12 activation (E) in HEK293 cells transfected with WT AT1 receptor (black) or D2.50N (green), N3.35A (red), and Y7.53I (yellow) mutants. Three independent experiments were performed and representative dose-response curves were shown. The bars indicate the mean ± SEM values. F Heat map of AT1 receptor signaling signatures of WT AT1 receptor and mutants. Blue and red squares represent decreased or increased activity compared with WT AT1 receptor. The relative activities Δlog(τ/KA) of WT AT1 receptor and mutants in each signaling pathway calculated in (Supplementary Note 17) were expressed as a heat map. Color scales of the map are shown on the right. ΔBRET: the change of bioluminescence resonance energy transfer value.

