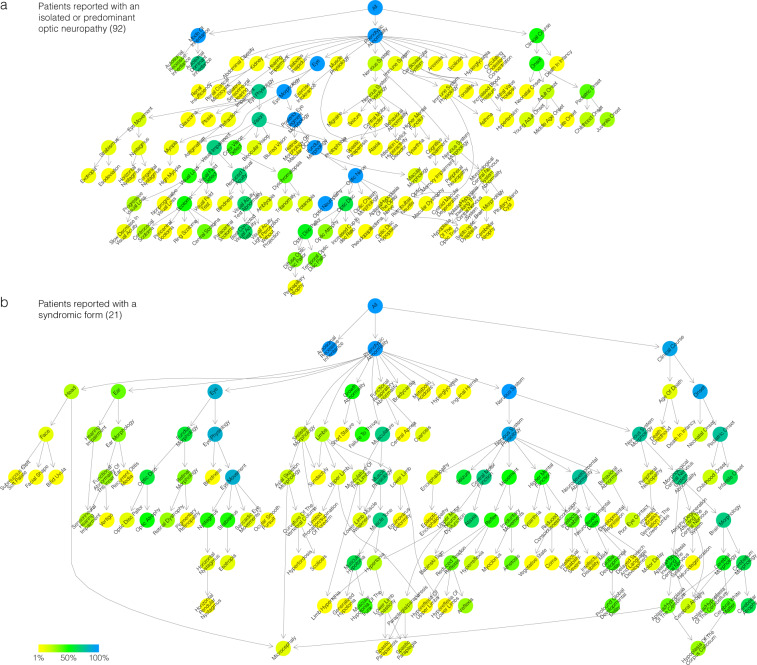
Fig. 4.
Visualisation of ontological annotation in the ACO2 dataset by disease. Subgraphs of the mode of inheritance (HPO# HP:0000005), the phenotypic abnormalities (HPO# HP:0000118) and the natural history of the disease (Clinical Course, HPO# HP:0031797), descending from the root of all terms (All; HPO# HP:0000001) in the Human Phenotype Ontology: (a) for the 92 patients reported with an isolated or predominant optic neuropathy; (b) for the 21 remaining patients reported with a syndromic form. Terms which are annotated to exactly the same objects as well as all of their children have been removed, showing only informative terms. Arrows indicate relations between terms in the ontology. Colors correspond to the frequency of the phenotypes, from the least frequent in yellow to the most frequent in blue, the green color corresponding to a term present in half of the patients. Human readable shortened ontological term names were used (where possible). Data as of June 8, 2020.

