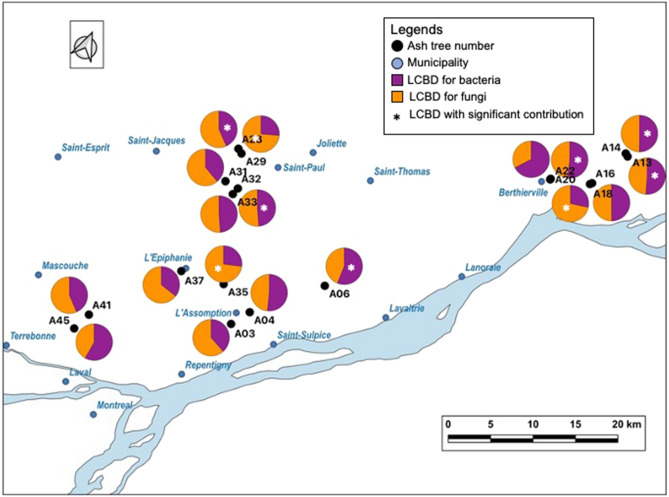
Figure 1.
Map representing sampling sites including the LCBD value per site. For each site LCBD values of bacteria (purple) and fungi (orange) are represented in percentages illustrated in a pie chart. The white star on the colour indicates the significant contribution of the corresponding community to the local β-diversity. Thus, the bacterial community was found significantly contributing to the local β-diversity in six sites (A06, A13, A14, A22, A28, and A32), Holm-corrected LCBD p values, whereas the fungal community was found significantly contributing to the local β-diversity in three sites (A18, A29, and A35), Holm-corrected LCBD p values.

