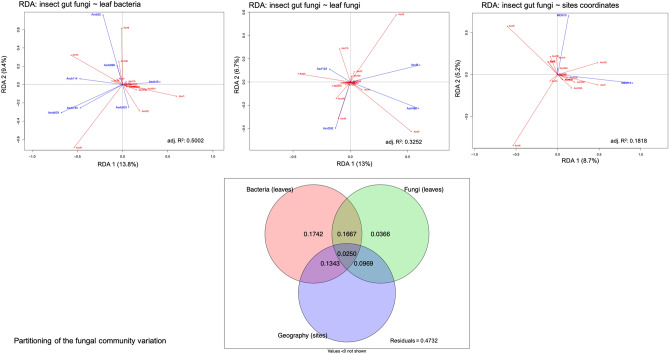
Figure 5.
Variation partitioning of the gut fungal community among three predictor matrices: bacteria associated with leaves (Hellinger-transformed), fungi associated with leaves (Hellinger-transformed), and dbMEM spatial eigenfunctions generated from the geographic coordinates of the sampling sites (Fraxinus trees). The selected explanatory variables (leaves) are represented in blue, and the response variables (insects’ gut) in red. Thus, the three explanatory matrices (bacteria, fungi, and geographic coordinates) are represented in individual RDA analyses. The adjusted R-square (adj.R2) corresponds to the R2 adjusted to the model containing all variables. The figure below the RDAs represents the partitioning variation analyses of the fungal community associated with adult EAB gut.

