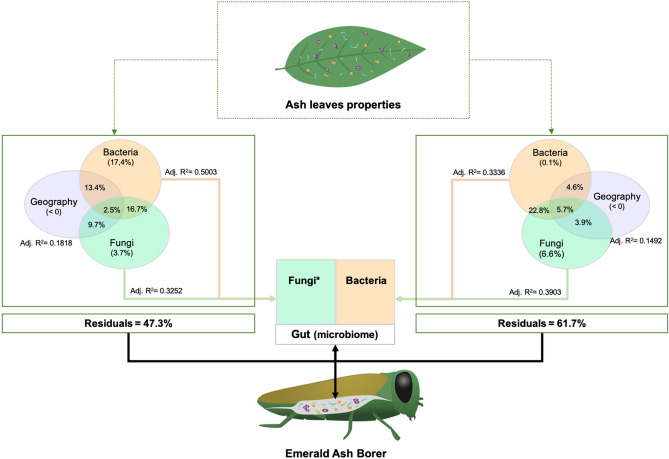
Figure 6.
Global representation showing variation partitioning analysis of microbial communities associated with leaves on the microbial communities associated with adult EAB gut. The host tree descriptors that have been found as explanatory matrices (bacteria, fungi, and geographic coordinates) are represented on the left portion (for the variation of the EAB gut fungal community), and on the right portion (for the variation of the EAB gut bacterial community). The dash box indicates the explanatory variable (properties of the host tree), and the values indicated in the circle correspond to the percentage of explanation. *After computing a forward selection (alpha < 0.05) prior to multiple regressions. The cellulose content significantly explained the species richness observed in the fungal community associated with the adult EAB gut.

