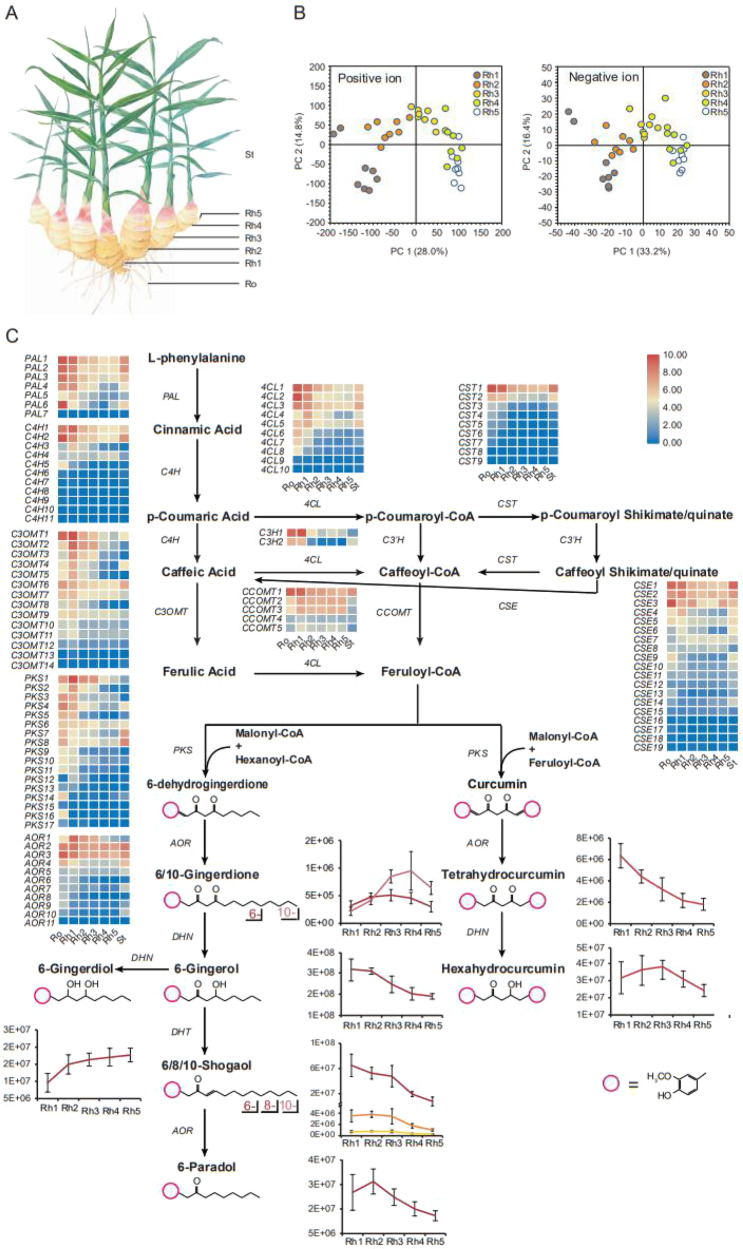
Fig. 4. Metabolites in ginger rhizomes and gingerol biosynthesis.
A Representative graph of ginger showing the root and five rhizome developmental stages was used in sample collection. B Principal component analysis (PCA) of ginger rhizome metabolites identified in positive and negative ion modes. Eight biological replicates were performed for each developmental stage. C Schematic representation of backbone pathways of gingerol biosynthesis and the expression of key genes. The heatmap shows the level of gene expression in different tissues from red (higher expression) to blue (lower expression). The gene names are given on the left, and the tissue names are given at the bottom. The genes include phenylalanine ammonia lyase (PAL), cinnamate 4-hydroxylase (C4H), 4-coumarate-CoA ligase (4CL), p-coumaroyl shikimate transferase (CST), p-coumaroyl 5-O-quinate/shikimate 3’-hydroxylase (C3’H), caffeoylshikimate esterase (CSE), caffeic acid 3-O-methyltransferase (C3OMT), caffeoyl-CoA O-methyltransferase (CCOMT), polyketide synthase (PKS), NADPH-dependent alkanal/one oxidoreductase (AOR), dehydrogenase (DHN), and dehydratase (DHT). The line graph shows changes in the metabolite contents at different rhizome developmental stages. The vertical axis represents metabolite abundance

