Figure 5.
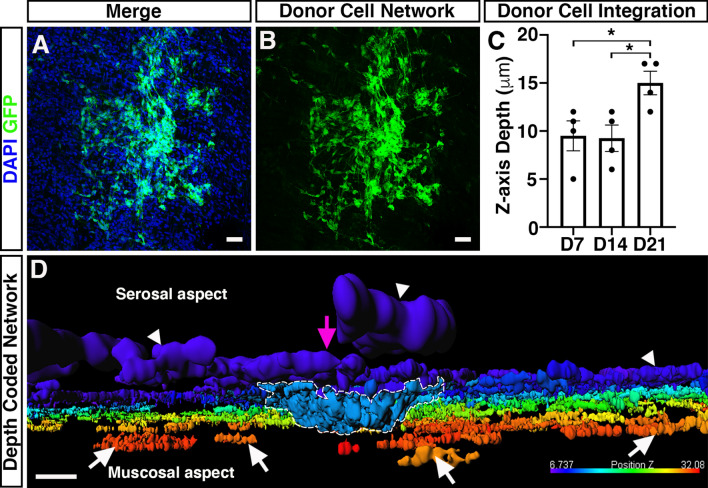
Integration of ENSC-derived donor cells across the gut wall. (A, B) Representative confocal z-stack image of donor ENSC-derived GFP+ (green), and DAPI (blue), within the gut wall 21-days after ex vivo transplantation. (C) Summary data showing analysis of donor cell body (GFP+/DAPI+) integration, measured as z-axis depth, across the gut wall at day-7 (D7), D14, and D21 after ex vivo transplantation (n = 4 for each timepoint). (D) Representative depth-coded image of donor cell integration at D21. Note the protrusion of donor ENSC-derived cells into the gut wall (dashed line) from the site of transplantation on the serosal surface (magenta arrowhead). Donor GFP+ cells and fibres were observed to have integrated longitudinally along the gut, both on the serosal surface (arrowheads) and within the tunica muscularis (arrows). Scale bars represent 50 μm (A, B), 30 μm (D). Error bars represent mean ± s.e.m. *P ≤ 0.05, by Welch’s t-test.

