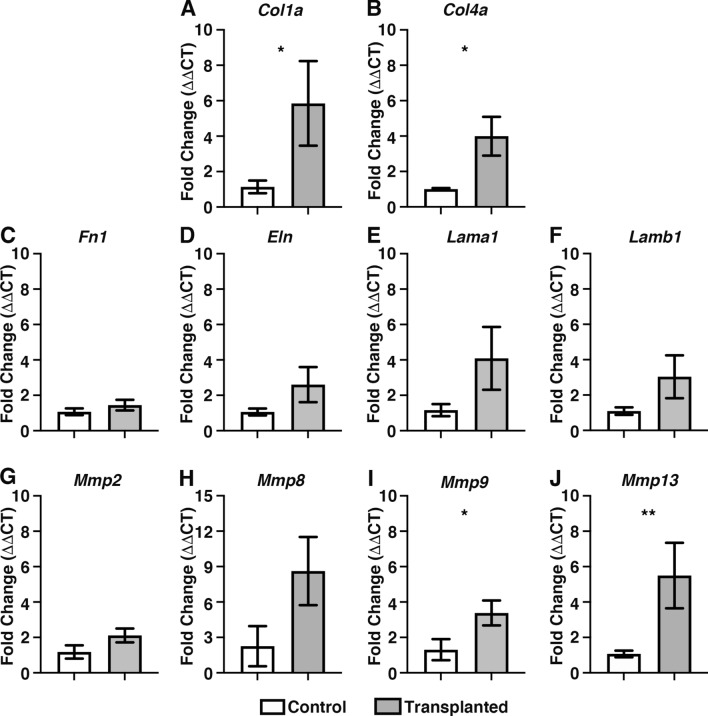
Figure 7.
Donor cell integration leads to increased expression of collagen and Matrix metalloproteinases. (A–F) Summary data showing mRNA fold change for ECM-related and matrix metalloproteinase genes: (grey bars): Collagen 1a (Col1a; A), Collagen 4a (Col4a; B) Fibronectin 1 (Fn1; C), Elastin (Eln; D), Laminin a1 (Lama1: E), Laminin b1 (Lamb1: F), Matrix metalloproteinase-2 (Mmp2; G), Matrix metalloproteinase-8 (Mmp8; H), Matrix metalloproteinase-9 (Mmp9; I) and Matrix metalloproteinase-13 (Mmp13; J) 21-days after ex vivo transplantation compared to non-transplanted control (white bars) tissues. Error bars represent mean ± s.e.m. n = 4 for each gene examined. *P ≤ 0.05, **P ≤ 0.01 comparing ΔCT values by Welch’s t-test.

