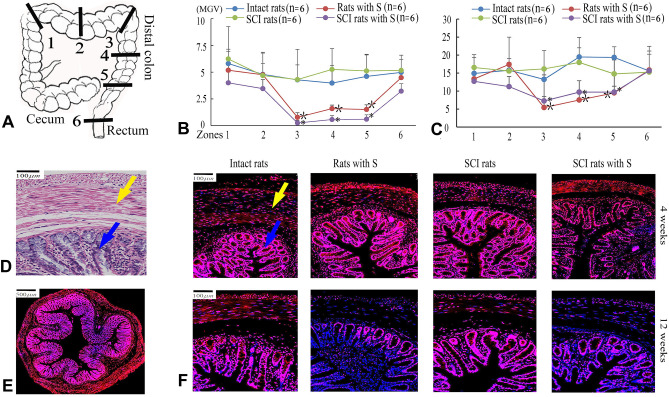
Figure 5.
Distribution of Alpha-2 adrenergic receptor in colon. (A) The excised sections were showed by zones. (B, C) The mean grayscale value (MGV) of Alpha-2 adrenergic receptors in colonic smooth muscle layer (B) and colonic mucosa layer (C) 12 weeks after PSIMA. *SCI rats with S versus SCI rats, †Rats with S versus Intact rats in Zone 3, 4, 5, P < 0⋅05 (two-way ANOVA). (D) Colonic tissue (TRI staining), the smooth muscle tissues are directed by the yellow arrows, and the colonic mucosa tissue by the blue arrows. (E, F) Representative fluorescent images of Alpha-2 adrenergic receptors (red) in colonic tissue, cross-sectional anatomy of colon (E), and high-power images (F).

