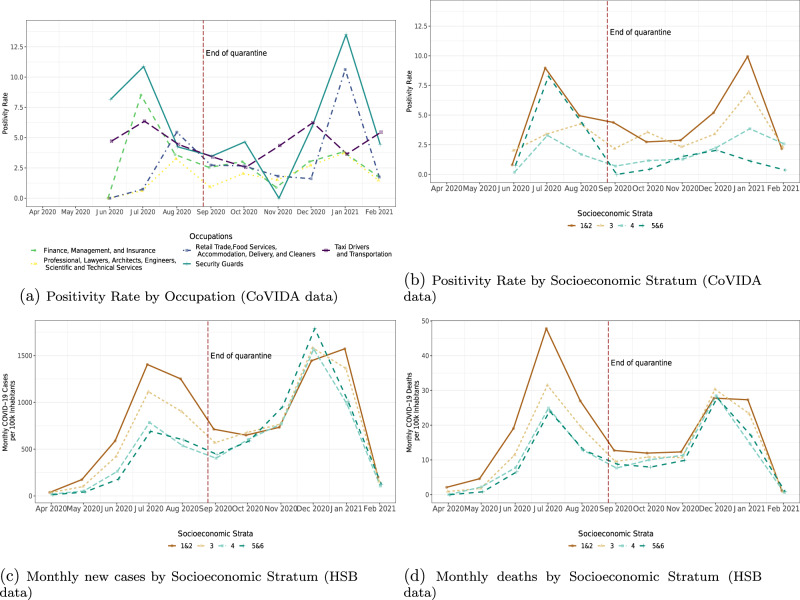
Fig. 3. Monthly dynamics.
The figure shows weighted monthly COVID-19 positivity rates (a, b) from CoVIDA data and monthly COVID-19 cases per 100,000 inhabitants (c, d) from the Health Secretary of Bogota (HSB). The vertical dashed line marks the end of quarantine on August 25, 2020. Weights are based on workers' occupation to be representative of Bogota’s population. To maintain comparability, (d) uses the date of the positive test of deceased individuals on the horizontal axis. See Supplementary Fig. 7 for 95% confidence intervals.

