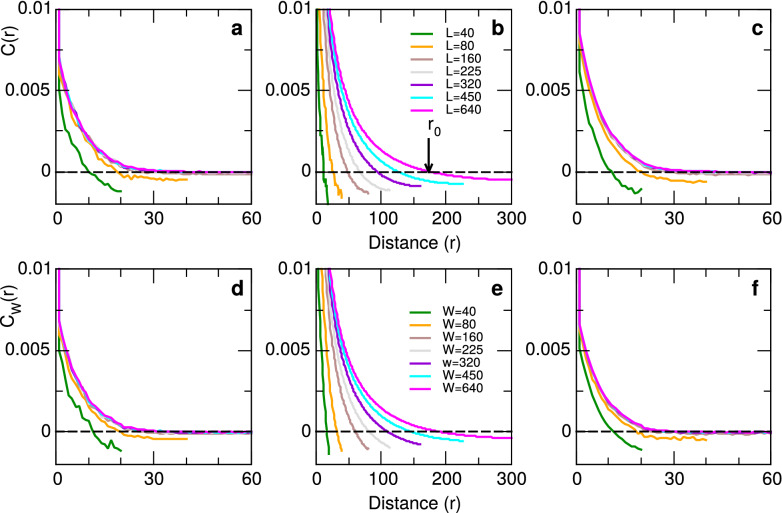
Figure 1.
Connected correlation function of the neuronal network model. Curves in panels (a–c) for different system sizes L and those in (d–f) for different window sizes W computed on a system of size . Results are for three control parameter values corresponding to sub-critical ( = 0.64, panels a,d), critical ( = 1.024, panels b,e) and super-critical (, panels c,f) regimes of the model. Arrow in panel (b) illustrates the value of for .

