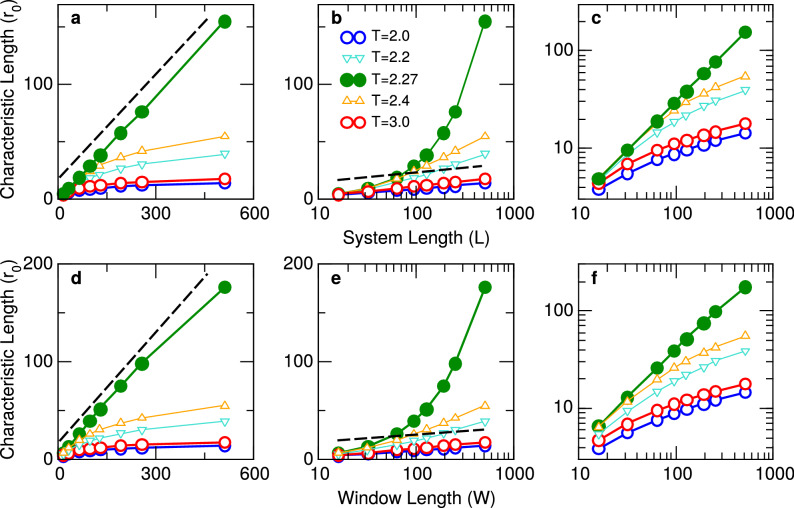
Figure 4.
Characteristic length of the ferromagnetic 2D Ising model. The zero crossings of the computed CCF are plotted in linear–linear (left), log–linear (middle) and log–log (right) axis. Top three panels correspond to different system sizes L and bottom three panels to different window lengths W. Different symbols correspond to the values of the temperature T denoted in the legends. Dashed lines are visual aids to emphasize the predicted logarithmic behavior for both sub-critical and super-critical regimes (open circles), and the linear dependence expected for the critical regime (filled circles). Open triangles are used to denote results obtained for intermediate values of temperature indicated in the legend. In all cases, error bars are omitted, since error estimates are smaller than symbol size.

