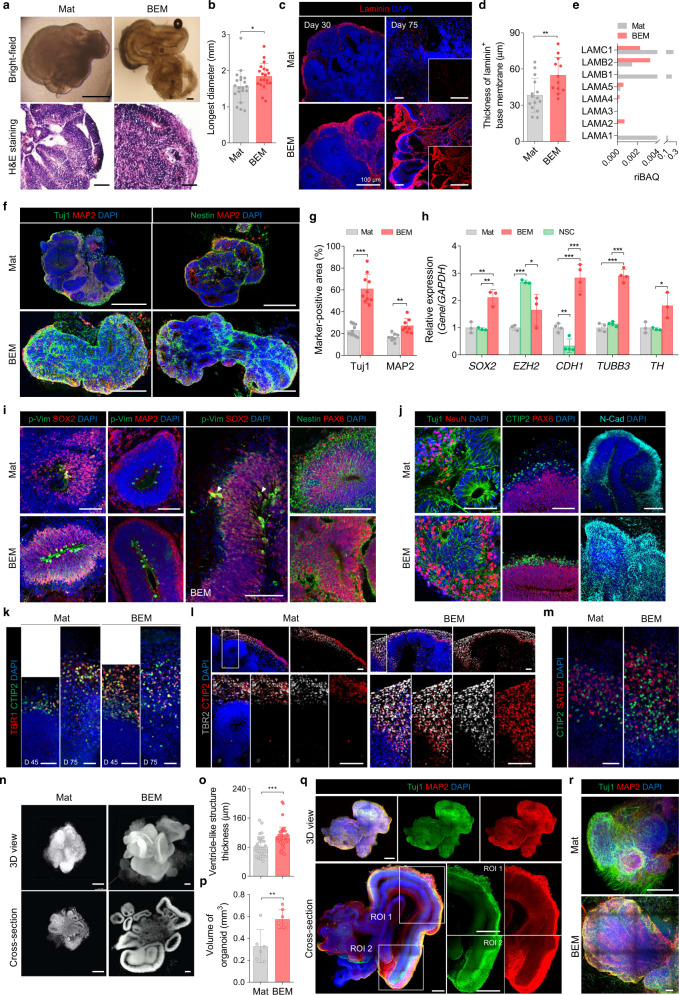
Fig. 2. BEM improves neurogenesis and organization of cortical layers in cerebral organoids.
a Bright-field images and hematoxylin and eosin (H&E) staining of Mat- and BEM-embedded brain organoids at day 30 (scale bars = 500 μm for bright-field and 100 μm for H&E staining images, independent replicates = 3). b Quantification of the longest diameter of Mat and BEM organoids based on the bright-field images of whole organoids (n = 20, Mat versus BEM p = 0.0349, independent replicates = 3). c Laminin staining of Mat and BEM organoids at 30 and 75 days (scale bars = 100 μm), and (d) quantification of the thickness of laminin+ basement membrane covering the outer surface of the organoids at day 30 (n = 15 for Mat and n = 12 for BEM, Mat versus BEM p = 0.0066, independent replicates = 5). e Comparison of relative intensity-based absolute quantification (riBAQ) values of laminin subtypes identified in Mat and BEM. f Immunohistochemical staining of neural progenitor marker (Nestin) and neuronal markers (Tuj1 and MAP2) at 30 days of culture (scale bars = 500 μm, independent replicates = 1–4). g Image-based quantification of the Tuj1- and MAP2-positive area in the Mat and BEM organoids at day 30 (n = 10 for Tuj1 and n = 15 for MAP2, Mat versus BEM p < 0.0001 for Tuj1; Mat versus BEM p = 0.0012 for MAP2, independent replicates = 2–7). h The quantitative real-time polymerase chain reaction (qPCR) analysis to compare gene expression between Mat, neural stem cells (NSCs), and BEM organoids at day 30 (n = 3 for SOX2, EZH2, and TH and n = 4 for CDH1 and TUBB3, 10–15 brain organoids collected as one sample batch, Mat versus BEM p = 0.0061, NSC versus BEM p = 0.0027 for SOX2; Mat versus NSC p < 0.0001, NSC versus BEM p = 0.0371 for EZH2; Mat versus BEM p = 0.0004, Mat versus NSC p = 0.0039, NSC versus BEM p = 0.0001 for CDH1; Mat versus BEM p < 0.0001, NSC versus BEM p < 0.0001 for TUBB3; NSC versus BEM p = 0.0346 for TH, independent replicates = 3). i Immunohistochemical staining for mitotic radial glia marker phosphorylated vimentin (p-Vim), SOX2, Nestin, and PAX6, and neuron marker MAP2 in Mat and BEM organoids at day 30 (scale bars = 100 μm, independent replicates = 6). Note that some p-Vim+/SOX2+ cells are located above the apical domain (white arrowheads). j Immunohistochemical staining for Tuj1 and NeuN at day 30, CTIP2 and PAX6, and N-cadherin (N-Cad) at day 45 in Mat and BEM organoids (scale bars = 100 μm, independent replicates = 2–5). k Immunohistochemical stained images for deep-layer neuron markers TBR1 and CTIP2 at 45 and 75 days (scale bars = 50 μm, independent replicate = 1). Immunostaining images for (l) intermediate progenitor marker TBR2 and CTIP2 and (m) superficial-layer neuron marker SATB2 and CTIP2 in 75-day organoids (scale bars = 50 μm, independent replicate = 1). n Nucleus-stained (Cyto16) light-sheet microscopic images of Mat and BEM organoids at day 75 (scale bars = 500 μm, independent replicates = 5). Quantification of (o) the thickness of ventricle-like structures (n = 30 for Mat and n = 45 for BEM, Mat versus BEM p = 0.0007) and (p) the total organoid volume (n = 6 for Mat and n = 9 for BEM, Mat versus BEM p = 0.0035) based on nucleus-stained (Cyto16) light-sheet microscopic images of Mat and BEM organoids at day 75 (independent replicates = 5). q 3D reconstituted images of 30-day BEM organoids obtained by tissue clearing and subsequent immunostaining for Tuj1 and MAP2 (scale bars = 1 mm, independent replicate = 1). r 3D images of Mat and BEM organoids stained for Tuj1 and MAP2 after tissue clearing at day 75 (scale bars = 200 μm, independent replicates = 3–5). Mat and BEM organoids were cultured in a dish on an orbital shaker. All data are expressed as mean ± standard deviation (SD). Statistical differences between the groups were determined with a two-sided t-test (*p < 0.05, **p < 0.01, ***p < 0.001). Source data are provided as a Source Data file.

