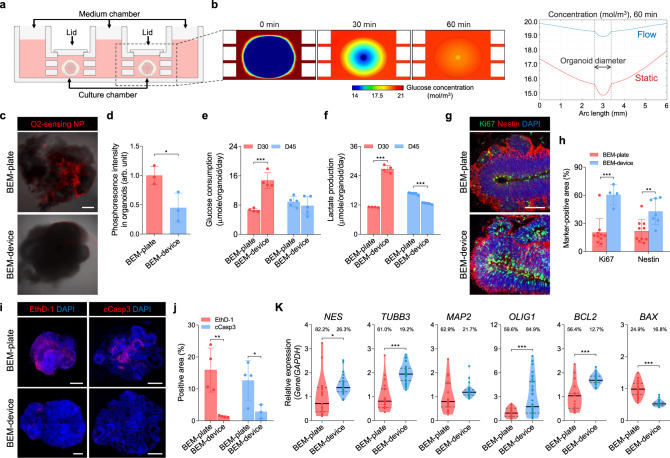
Fig. 5. Microfluidic dynamic culture supports the proliferation and prevents the apoptosis of brain organoids grown in the 3D BEM.
a Schematic diagram of the microfluidic device for the brain organoid culture. b Computational simulation of glucose concentration within the brain organoid and its surroundings in a culture chamber under the fluid flow conditions (left). Comparison of glucose concentration within the brain organoid in the presence and absence of fluid flow (right). c Representative merged images showing organoids (gray) and phosphorescence of oxygen-sensing (PtTFPP-PUAN) nanoparticles at 754 nm (red) for BEM-plate (top) and BEM-device (bottom) organoids on day 30 (scale bars = 200 μm, independent replicates = 4). d The normalized mean phosphorescence intensity in BEM-plate and BEM-device organoids (n = 3 per group, BEM-plate versus BEM-device p = 0.032, independent replicates = 4). Measurement of (e) glucose level in organoids and (f) lactate level in the medium at days 30 and 45 (n = 4 for D30 and n = 5 for D45, BEM-plate versus BEM-device p < 0.0001 at D30 and p < 0.0001 at D45, independent replicates = 2 for day 30 and 1 for day 45). g Immunostaining for the proliferation marker Ki67 and the progenitor marker Nestin in the BEM-plate and BEM-device organoids (scale bars = 50 μm, independent replicates = 3). h The quantification analyses of Ki67+ and Nestin+ cells in the BEM-plate and BEM-device organoids (n = 10 for BEM-plate group, and n = 4 for Ki67+ and n = 7 for Nestin+ in BEM-device group, BEM-plate versus BEM-device p = 0.0004 for Ki67 and p = 0.005 for Nestin, independent replicates = 3). i Brain organoids stained with ethidium homodimer-1 (EthD-1) to label dead cells at day 30 and cleaved caspase-3 (cCasp3) at day 45 (scale bars = 500 μm). j Quantification of EthD-1+ and cCasp3+ area per organoid (n = 4 for BEM-plate group, n = 4 for EthD-1+ and n = 3 for cCasp3+ in BEM-device group, BEM-plate versus BEM-device p = 0.0056 for EthD-1 and p = 0.049 for cCasp3, independent replicates = 3). k Differential gene expression analyses by qPCR with BEM-plate and BEM-device organoids. One sample was prepared from a single organoid. The coefficient of variations is dictated above the bars for each group. Data are expressed as violin plots. Dark gray dashed lines and black lines indicate 25–75% quartiles and median, respectively (n = 19 for BEM-plate group and n = 30 for BEM-device group in all markers except for OLIG1, n = 29 for BEM-plate group and n = 35 for BEM-device group in OLIG1, BEM-plate versus BEM-device p = 0.0102 for NES, p < 0.0001 for TUBB3, p = 0.0001 for OLIG1, p < 0.0001 for BCL2, and p < 0.0001 for BAX, independent replicates = 4). All analyses were performed over 30 days in the culture. All data are expressed as mean ± SD, otherwise stated separately. Statistical differences between the groups were determined by unpaired two-tailed t-test (*p < 0.05, **p < 0.01, ***p < 0.001 versus BEM-plate group). Source data are provided as a Source Data file.

