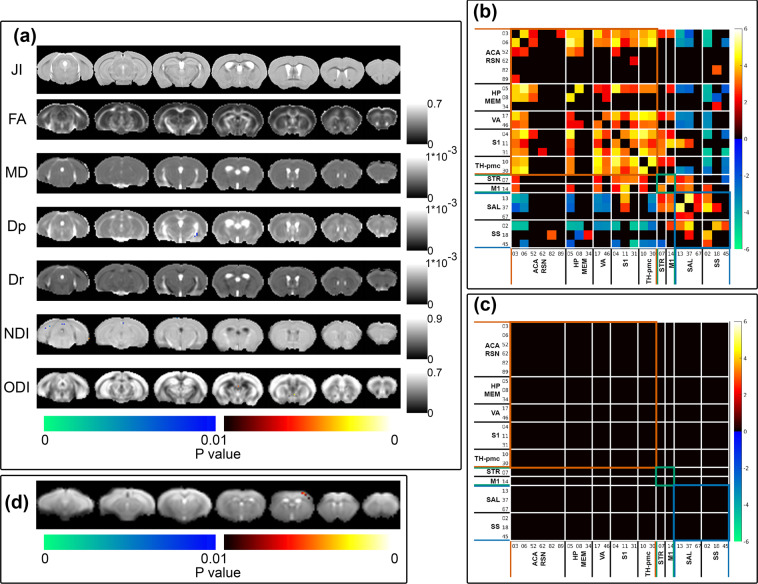
Fig. 3.
Randomise reproducibility test of MRI data. (a) Voxel-by-voxel statistical analysis results of Tensor-based morphometry (JI = Jacobian Index) Diffusion Tensor Imaging (FA = Fractional Anisotropy, MD = Mean Diffusivity, Dp = Parallel Diffusivity, Dr = Radial Diffusivity) and Neurite Orientation Dispersion and Density Imaging metrics (NDI = Neurite Density Index, ODI = Orientation Dispersion Index). Statistical map thresholded at p value < 0.01 (one-tailed), unpaired two sample t-test, implemented as permutation tested for the General Linear Model, corrected for multiple comparisons with mass-based FSL’s Threshold-free Cluster enhancement (TFCE). Statistical maps were overlaid on the averaged and registered structural images, DTI and NODDI metrics maps corresponding to the statistical maps (JI, DTI and NODDI results). Corresponding grey scale map for each averaged DTI and NODDI metrics maps were provided; units for Dp, Dr, and MD were in mm2/s. (b) One sample t-test result of component-component functional network connectivity across all sham animals (n = 14) and (c) Two sample t-test result of component-component functional network connectivity differences between sham cohort’s pseudo-groups. Colour map scaled by z test statistics; non-black cells were defined as component-component functional connectivity deemed statistically significant in permutation-based inference of the General Linear model, corrected for multiple comparison with False Discovery Rate, and thresholded at q value < 0.05 (two-tailed). (d) two-sample t-test results comparing sham cohort’s two pseudo-groups stimulus-evoked activation independent component spatial map, implemented as permutation tested for the General Linear Model, corrected for multiple comparisons with mass-based FSL’s Threshold-free Cluster enhancement (TFCE), and thresholded at p value < 0.01 (one-tailed). Figure legends previously included in14.

