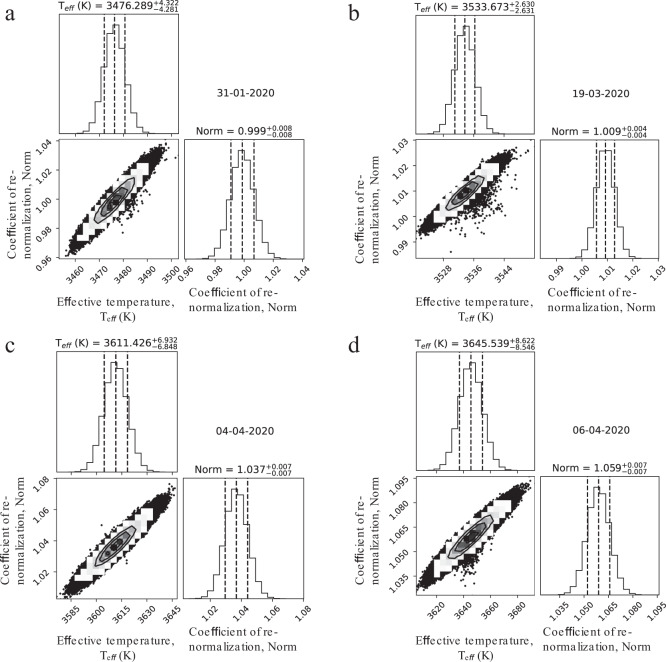
Fig. 6. Four corner plots with the final effective temperatures (Teff) of Betelgeuse obtained at four epochs 31-01-2020, 19-03-2020, 04-04-2020, and 06-04-2020.
a The best-fit Teff and its uncertainties were obtained on 31-01-2020. The panel corresponding to the fit of the region at 7700–7900 Å is shown in Supplementary Fig. 4a. b The best-fit Teff and its uncertainties were obtained on 19-03-2020. The panel corresponding to the fit of the region at 7700–7900 Å is shown in Supplementary Fig. 4b. c The best-fit Teff and its uncertainties were obtained on 04-04-2020. The panel corresponding to the fit of the region at 7700–7900 Å is shown in Supplementary Fig. 4c. d The best-fit Teff and its uncertainties were obtained on 06-04-2020. The panel corresponding to the fit of the region at 7700–7900 Å is shown in Supplementary Fig. 4d. On each panel, the diagonal shows the marginalized posteriors. The subsequent covariances between all the parameters are in the corresponding 2D histograms. The vertical lines represent the 16, 50, and 84 percentiles. The best-fit parameters for Teff and their uncertainties are presented on the top of each panel. Uncertainty for Teff is defined as the difference between the 84th and 50th percentile as the upper limit, and the difference between the 50th and 16th percentile as the lower limit. The data of observations are marked in dd-mm-yyyy format.

